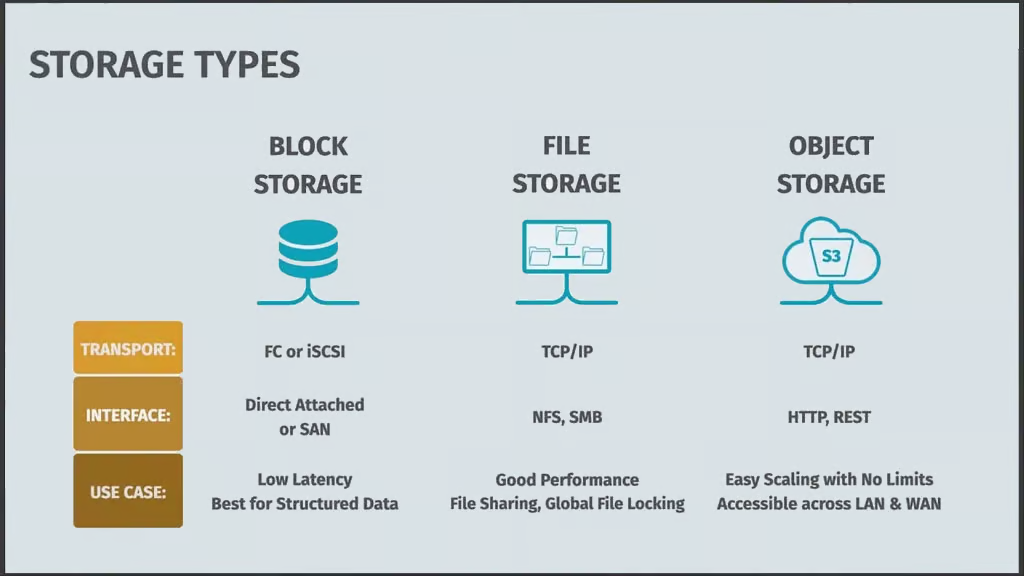
# Storage

{% hint style="info" %}

#### **Object Stores**

Object storage systems like Amazon S3 and MinIO provide a way to store and retrieve large amounts of unstructured data such as files, images, videos, and backups through a simple web-based API. Unlike traditional file systems that organize data in hierarchical folders, object stores use a flat namespace where each piece of data (called an object) is stored in containers called buckets and accessed via unique keys or URLs.

Amazon S3 is AWS's flagship object storage service that offers virtually unlimited scalability, multiple storage classes for different use cases, and integration with other AWS services.

MinIO is an open-source alternative that provides S3-compatible APIs and can be deployed on-premises or in private clouds, making it popular for organizations that want object storage capabilities without vendor lock-in.

Both systems are designed for high durability, availability, and can handle massive scale while providing simple REST API access for applications to store and retrieve data programmatically.
{% endhint %}

<figure><img src="/files/hekkupmXPybzDBrmG71Q" alt=""><figcaption><p>Storage</p></figcaption></figure>

{% hint style="danger" %}
The following steps are intended for setting up a Pentaho Lab environment and need to be completed in order to complete the Workshops.

Ensure you have downloaded the Workshop--Installation:

```bash
cd
git clone https://github.com/jporeilly/Workshop--Data-Integration
```

To install git:

```bash
sudo apt install git
```

{% endhint %}

{% hint style="info" %}
**Prerequisites**

* Ubuntu 24.04 LTS system (physical or virtual machine)
* User account with sudo privileges
* Internet connection
* Basic familiarity with Linux command line
  {% endhint %}

{% tabs %}
{% tab title="MinIO" %}
{% hint style="info" %}
**MinIO**

Follow the instructions below to setup a MinIO Docker Container.
{% endhint %}

Select your OS & add the Sample Data, finally configure a VFS connection in Data Integration:

{% tabs %}
{% tab title="Linux" %}
{% hint style="info" %}
Installs and configures MinIO on Ubuntu 24.04 running in Docker.
{% endhint %}

1. Create a MinIO folder and copy the required files.

{% hint style="info" %}
**Create directory & copy**

```sh
cd
cd ~/Workshop--Data-Integration/Setup/MinIO/linux
chmod +x ./copy-minio.sh && sudo ./copy-minio.sh
```

{% endhint %}

<figure><img src="/files/YyvrROcvQAPR6qY7Fpco" alt=""><figcaption><p>copy-minio.sh</p></figcaption></figure>

2. Ensure all the files have successfully been copied over.

```bash
cd 
cd /opt/minio
ls -al
```

2. Execute the docker-compose script to create the container.

{% hint style="info" %}
**MinIO Container**

```sh
cd
cd /opt/minio
sudo ./run-docker-minio.sh
```

{% endhint %}

<figure><img src="/files/BKSKFO0Zq6tMyv1EcoKv" alt=""><figcaption><p>run-docker-minio.sh</p></figcaption></figure>

{% hint style="warning" %}
Following best industry practices, MinIO is installed as root in the /opt/minio directory. If you wish the pentaho user to also manage the service then you may need to add the user to the Docker group.

```bash
# Install to /opt/minio (system-wide)
sudo ./copy-minio.sh

# Add pentaho user to docker group (no sudo needed for Docker commands)
sudo usermod -aG docker pentaho

# Pentaho user can now manage MinIO without sudo
docker compose -f /opt/minio/docker-compose.yml ps
docker compose -f /opt/minio/docker-compose.yml logs

```

{% endhint %}

4. Check the container is up and running in Docker.

```bash
docker ps --filter "name=minio"
```

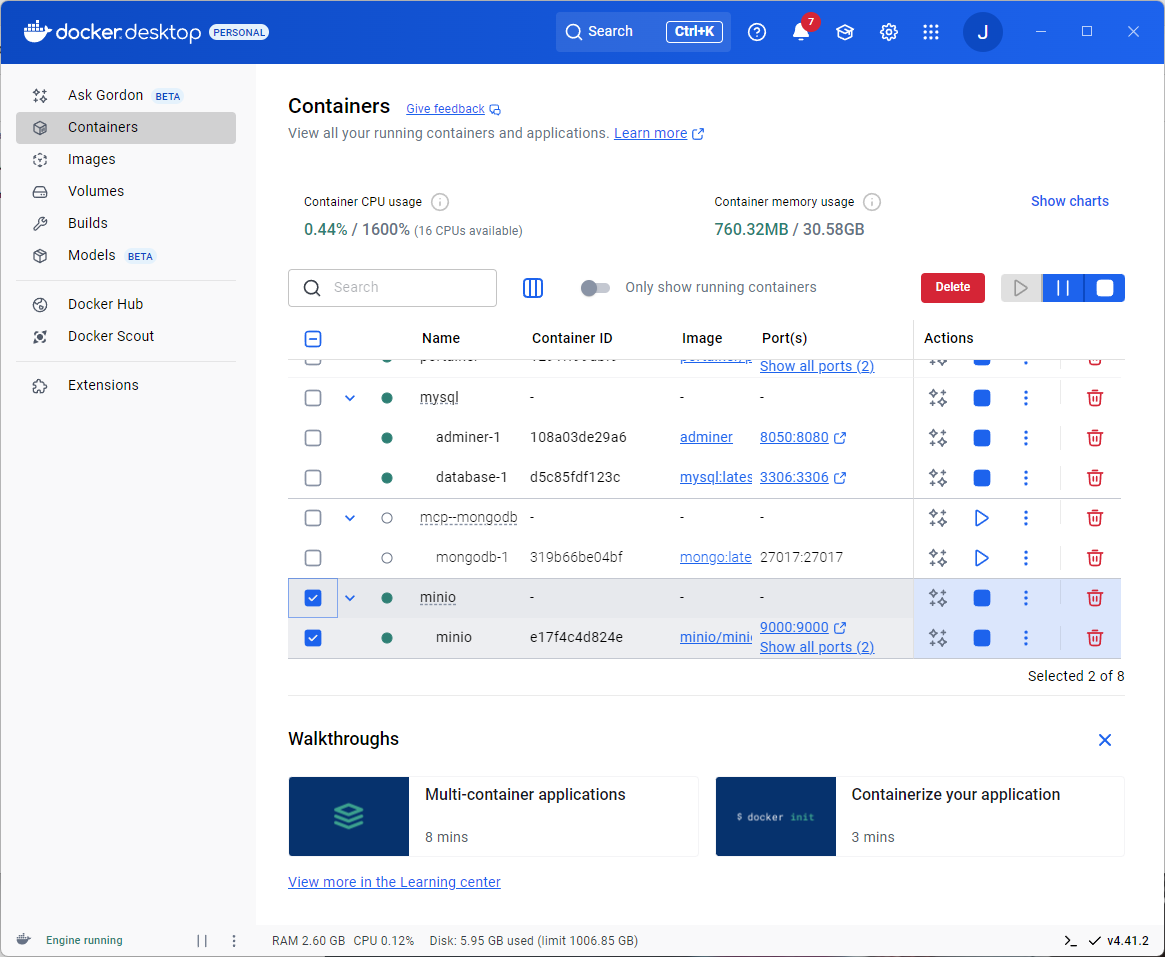
<figure><img src="/files/Tz4tqXLjvsyIX0zu9L9X" alt=""><figcaption><p>Check Docker minio container</p></figcaption></figure>

***

1. Log into MinIO.

{% embed url="<http://localhost:9002/login>" %}

Username: minioadmin

Password: minioadmin

{% hint style="info" %}
If you have completed the setup: [MinIO](/pentaho-data-integration/setup/data-sources/storage.md#minio) then you should have pre-populated buckets with various data objects in different formats.
{% endhint %}

<figure><img src="/files/0WhQkaZvcusFhlae0lSo" alt=""><figcaption></figcaption></figure>

***

**New Bucket**

If you need to create a Bucket:

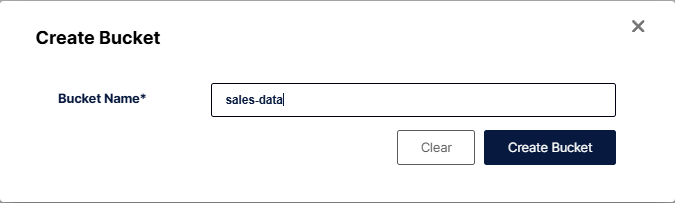
1. Click the 'Create Bucket' link.
2. Enter: sales-data & 'Create Bucket'.

<figure><img src="/files/4KTXgz5O9vxsx0upHsNe" alt=""><figcaption><p>Create Bucket.</p></figcaption></figure>

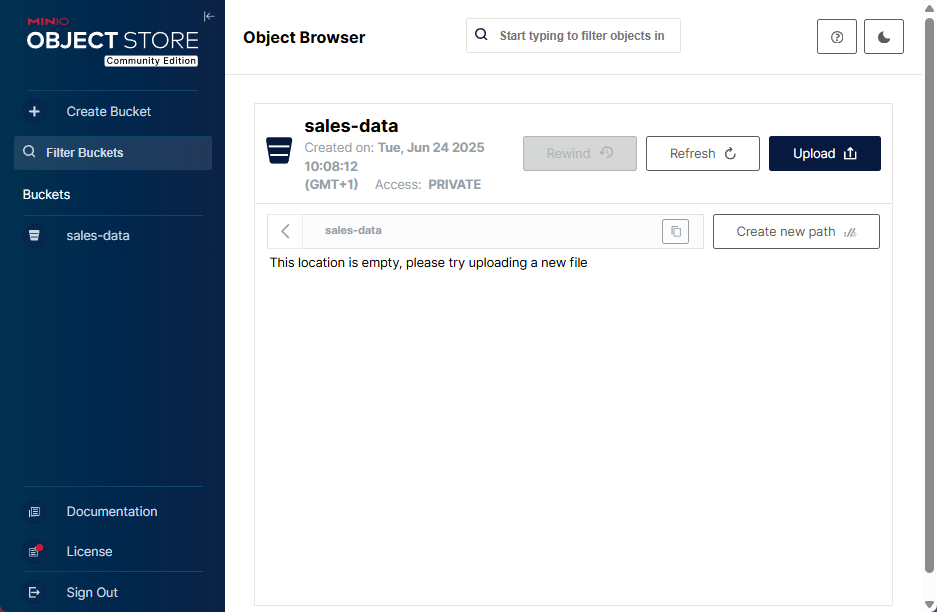
5. Click on the Upload button.

<figure><img src="/files/JwSwHwIeW6rt2lrR7JYj" alt=""><figcaption><p>Upload sales_data.csv</p></figcaption></figure>

6. Upload your data - for example some sales data:

{% hint style="info" %}
**Windows - PowerShell**

```powershell
Set-Location C:\Pentaho\design-tools\data-integration\samples\transformations\files

```

{% endhint %}

{% hint style="info" %}
**Linux**

```bash
cd
cd ~/Pentaho/design-tools/data-integration/samples/transformations/files

```

{% endhint %}

{% hint style="warning" %}

#### Workshops

**Pentaho Data Integration: MinIO Object Storage Workshop Series**

Modern organizations increasingly store their data in cloud-native object storage systems like MinIO and Amazon S3, moving away from traditional file servers and databases. This architectural shift enables scalable, cost-effective data lakes but introduces new challenges: data arrives in multiple formats (CSV, JSON, XML, Parquet), exists across distributed buckets, and requires sophisticated transformation pipelines to unlock its analytical value. Learning to efficiently extract, transform, and integrate data from object storage is now essential for any data integration professional working with contemporary data architectures.

In this comprehensive workshop series, you'll build progressively complex transformation pipelines that leverage MinIO object storage as both a source and destination for enterprise data integration scenarios. Starting with fundamental ETL patterns like denormalized fact table creation, you'll advance through intermediate challenges involving multi-format parsing and reconciliation, ultimately mastering advanced techniques like sessionization, anomaly detection, and schema normalization across heterogeneous data sources.

Each workshop introduces real-world business scenarios - from sales dashboards to customer analytics to operational monitoring - demonstrating PDI's versatility in solving diverse integration challenges while maintaining cloud-native architecture principles.

**What You'll Accomplish:**

* Configure VFS (Virtual File System) connections to access S3-compatible MinIO object storage
* Build multi-source ETL pipelines using Text File Input steps with S3 paths (s3a://)
* Implement Stream Lookup and Merge Join patterns to enrich data from multiple CSV sources
* Parse semi-structured formats including XML inventory feeds and JSONL event streams
* Apply full outer joins to identify discrepancies between warehouse and catalog systems
* Aggregate customer data across transactional, demographic, and behavioral dimensions
* Perform sessionization and funnel analysis on clickstream data using Group By and pivoting
* Extract structured data from unstructured logs using Regular Expression evaluation
* Detect anomalies in time-series data through rolling averages and conditional logic
* Normalize schemas across CSV, JSON, and XML sources into unified data lake structures
* Implement data validation, deduplication, and quality controls for multi-format ingestion
* Calculate derived metrics including customer lifetime value, engagement scores, and conversion rates
* Route data dynamically using Switch/Case and Filter Rows for conditional processing
* Output transformed data to staging and curated layers following data lake architecture patterns

By the end of this workshop series, you'll have mastered the complete spectrum of cloud-native data integration patterns using Pentaho Data Integration. You'll understand how to handle diverse source formats, implement sophisticated join and aggregation logic, perform advanced text parsing and time-series analysis, and build production-ready pipelines that leverage object storage for scalable, distributed data processing.

Instead of treating each data format as a unique challenge requiring custom scripts, you'll confidently design reusable, visual transformation workflows that automate complex integration scenarios - from operational reconciliation to customer intelligence to real-time anomaly detection.

**Prerequisites:** MinIO running with sample data populated; basic understanding of transformation concepts (steps, hops, preview); familiarity with joins and aggregations

**Estimated Time:** 4-6 hours total (individual workshops range from 20-60 minutes based on complexity)
{% endhint %}

<table><thead><tr><th width="187">Workshop</th><th>Key Skills</th></tr></thead><tbody><tr><td>Sales Dashboard</td><td>joins, lookups, aggregations</td></tr><tr><td>Inventory Reconciliation</td><td>XML parsing, outer joins, variance</td></tr><tr><td>Customer 360</td><td>multi-source, JSONL, calculations</td></tr><tr><td>Clickstream Funnel</td><td>sessionization, pivoting</td></tr><tr><td>Log Parsing</td><td>regex, time-series analysis</td></tr><tr><td>Data Lake Ingestion</td><td>schema normalization, validation</td></tr></tbody></table>

1\. Verify that MinIO is running and populated.

```bash
# Check MinIO is running
curl -sf http://localhost:9000/minio/health/live && echo "MinIO OK" || echo "MinIO not running"

# Verify data exists (using mc client)
mc ls minio-local/raw-data --recursive
```

2. Start Pentaho Data Integration.

{% hint style="info" %}
**Windows - PowerShell:**

```powershell
Set-Location C:\Pentaho\design-tools\data-integration
.\spoon.bat
```

{% endhint %}

{% hint style="info" %}
**Linux:**

```bash
cd
cd ~/Pentaho/design-tools/data-integration
./spoon.sh
```

{% endhint %}

***

**Workshops**

{% tabs %}
{% tab title="Sales Dashboard" %}
{% hint style="warning" %}

#### Sales Dashboard

The workshop demonstrates how Pentaho Data Integration enables organizations to rapidly create denormalized fact tables that power real-time business intelligence dashboards. By integrating data from multiple sources (customer data, product catalogs, and sales transactions), business users gain immediate access to actionable insights without waiting for IT to build complex data warehouses.

**Scenario:** A mid-sized e-commerce company needs to track daily sales performance across products, customer segments, and regions. Currently, sales managers wait 24-48 hours for IT to generate reports from disparate systems. With PDI, they can automate this process and refresh dashboards hourly.

**Key Stakeholders:**

* Sales Directors: Need to identify top-performing products and regions
* Marketing Teams: Require customer segmentation for targeted campaigns
* Finance: Need accurate revenue reporting by product category
* Operations: Must monitor inventory turnover rates
  {% endhint %}

<figure><img src="/files/z8GQ0foavHg7YOap5J9C" alt=""><figcaption><p>Sales Dashboard</p></figcaption></figure>

Follow the steps to create the transformation:

{% tabs %}
{% tab title="1. Text File Input" %}
{% hint style="info" %}

#### **Text File Input**

The Text File Input step is used to read data from a variety of different text-file types. The most commonly used formats include Comma Separated Values (CSV files) generated by spreadsheets and fixed width flat files.

The Text File Input step provides you with the ability to specify a list of files to read, or a list of directories with wild cards in the form of regular expressions. In addition, you can accept filenames from a previous step making filename handling more even more generic.
{% endhint %}

<figure><img src="/files/l0loAmeYXrST39llxG2g" alt=""><figcaption><p>Test File Inputs</p></figcaption></figure>

1. Drag & drop 3 Text File Input Steps onto the canvas.
2. Save transformation as: `sales_dashboard_etl.ktr` in your workshop folder.

***

**Sales (Order Management)**

1. Double-click on the first TFI step, and configure with the following properties:

| Setting          | Value                                 |
| ---------------- | ------------------------------------- |
| Step name        | `Sales`                               |
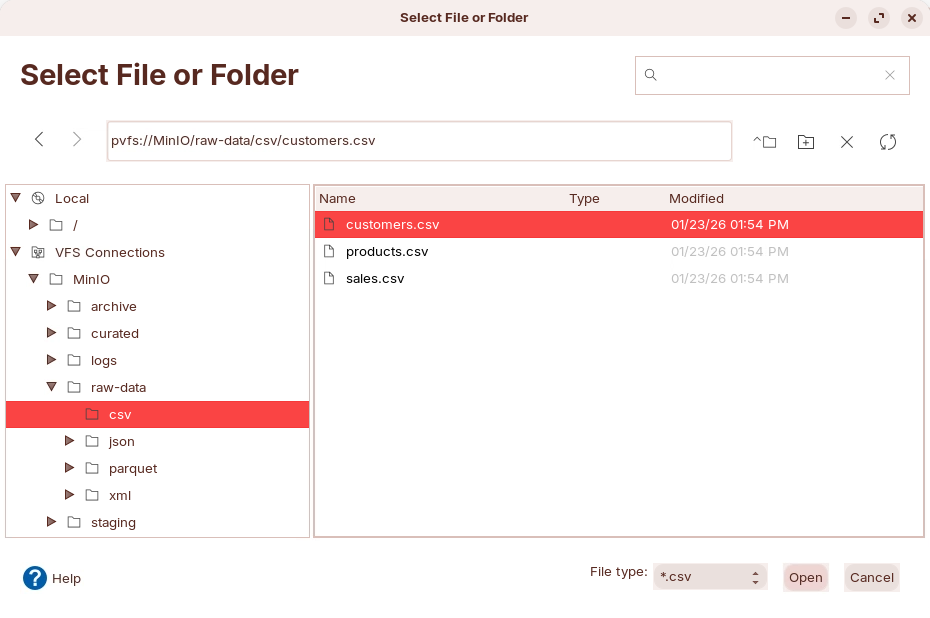
| Filename         | `pvfs://Minio/raw-data/csv/sales.csv` |
| Delimiter        | ,                                     |
| Head row present | ✅                                     |
| Format           | mixed                                 |

<figure><img src="/files/XlXKeRhImBeHbuaSmdUZ" alt=""><figcaption><p>Select - sales.csv from VFS connections</p></figcaption></figure>

2. Click: **Get Fields** to auto-detect columns.

{% hint style="info" %}
**Business Logic:** Note that `sale_amount` may differ from `price * quantity` due to:

* Volume discounts
* Promotional pricing
* Customer-specific pricing tiers
* Currency conversion (for international sales)
  {% endhint %}

<figure><img src="/files/nLGRIikQYnpXPcuFjQy7" alt=""><figcaption><p>Get Fields - Sales</p></figcaption></figure>

3. Preview data.

<figure><img src="/files/RNrGgMfChgJ6FwVj3Qzh" alt=""><figcaption><p>Preview data - Sales</p></figcaption></figure>

{% hint style="info" %}
**Business Significance:**

* `sale_amount`: Actual revenue (may include discounts)
* `quantity`: Volume metrics for demand planning
* `payment_method`: Payment preference insights
* `status`: Filter out cancelled/refunded orders
  {% endhint %}

***

**Products (ERP system)**

1. Double-click on the second TFI step, and configure with the following properties:

<table><thead><tr><th width="165.5">Setting</th><th>Value</th></tr></thead><tbody><tr><td>Step name</td><td><code>Products</code></td></tr><tr><td>Filename</td><td><code>pvfs://Minio/raw-data/csv/products.csv</code></td></tr><tr><td>Delimiter</td><td>,</td></tr><tr><td>Head row present</td><td>✅</td></tr><tr><td>Format</td><td>mixed</td></tr></tbody></table>

<figure><img src="/files/NU4Daf3mNASlhknTwnz8" alt=""><figcaption><p>Select - products.csv from VFS connections</p></figcaption></figure>

2. Click: **Get Fields** to auto-detect columns.

<figure><img src="/files/AxuVByWQb1QbFvSv50AD" alt=""><figcaption><p>Get Fields - Customers</p></figcaption></figure>

3. Preview the data.

<figure><img src="/files/hn3ULfxvGNDbqt8SbzdO" alt=""><figcaption><p>Preview data - Products</p></figcaption></figure>

{% hint style="info" %}
**Business Significance:**

* `category`: Enables product performance analysis by segment
* `price`: Base pricing for margin calculations
* `stock_quantity`: Inventory turnover insights
  {% endhint %}

***

**Customers (CRM System)**

1. Double-click on the third TFI step, and configure with the following properties:

<table><thead><tr><th width="186">Setting</th><th>Value</th></tr></thead><tbody><tr><td>Step name</td><td><code>Customers</code></td></tr><tr><td>Filename</td><td><code>pvfs://MinIO/raw-data/csv/customers.csv</code></td></tr><tr><td>Delimiter</td><td>,</td></tr><tr><td>Header row present</td><td>✅</td></tr><tr><td>Format</td><td>mixed</td></tr></tbody></table>

<figure><img src="/files/qlGSSjv4O4UDRABGcAcF" alt=""><figcaption><p>Select - customers.csv from VFS connections</p></figcaption></figure>

2. Click: **Get Fields** to auto-detect columns.

<figure><img src="/files/VFuUGVY6mL6gkeYXfpSF" alt=""><figcaption><p>Get Fields - Customers</p></figcaption></figure>

3. Preview the data.

<figure><img src="/files/3XBte9mlm55rWlsJJLbr" alt=""><figcaption><p>Preview data - Customers</p></figcaption></figure>

{% hint style="info" %}
**Business Significance:**

* `customer_id`: Primary key for joining to sales
* `country`: Critical for geographic segmentation
* `status`: Identifies churned vs. active customers
* `registration_date`: Enables customer tenure analysis
  {% endhint %}
  {% endtab %}

{% tab title="2. Stream Lookup" %}
{% hint style="info" %}

#### Stream Lookup

A **Stream lookup** step enriches rows by looking up matching values from another stream.

In a transformation, you feed your main rows into one hop and a reference dataset into the other hop. The step then matches rows using key fields and returns the lookup fields on the output. It’s the in-memory alternative to a database lookup, but the reference stream must be available in the same transformation flow.
{% endhint %}

<figure><img src="/files/kymRfUl1AELaQtUpydTz" alt=""><figcaption><p>Lookups</p></figcaption></figure>

1. Drag & drop 2 Stream Lookups Input Steps onto the canvas.
2. Save transformation as: `sales_dashboard_etl.ktr` in your workshop folder.

***

**Product Lookup**

1. Draw a Hop bewteen 'Sales' step & 'Product Lookup' step.
2. Draw a Hop bewteen 'Product' step & 'Product Lookup' step.

{% hint style="info" %}
The Sales is acting as our Fact table. It holds the transaction data for our Products & Customers.
{% endhint %}

3. Double-click on the 'Product Lookup' step, and configure with the following properties:

| Tab     | Setting               | Value            |
| ------- | --------------------- | ---------------- |
| General | Step name             | `Product Lookup` |
| General | Lookup step           | `Products`       |
| Keys    | Field (from Sales)    | `product_id`     |
| Keys    | Field (from Products) | `product_id`     |

4. In **Values to retrieve**, add:
   * `product_name` (rename to `product_name`)
   * `category` (rename to `product_category`)
   * `price` (rename to `unit_price`)

<figure><img src="/files/BiSRxM3nbWtPXFmNnQsX" alt=""><figcaption><p>Product Lookup</p></figcaption></figure>

***

**Customers Lookup**

1. Draw a Hop bewteen 'Product Lookup' step & 'Customers Lookup' step.
2. Draw a Hop bewteen 'Customers' step & 'Customers Lookup' step.
3. Double-click on the 'Customer Lookup' step, and configure with the following properties:

| Setting            | Value              |
| ------------------ | ------------------ |
| Step name          | `Customers Lookup` |
| Lookup step        | `Customers`        |
| Key field (stream) | `customer_id`      |
| Key field (lookup) | `customer_id`      |

4. Values to retrieve:
   * `first_name`
   * `last_name`
   * `country` (rename to `customer_country`)
   * `status` (rename to `customer_status`)

<figure><img src="/files/BsDF1EkIBHhICaeD4Ef6" alt=""><figcaption><p>Customers Lookup</p></figcaption></figure>

***

**Preview data**

1. Save the transformation.
2. RUN & Preview the data.

<figure><img src="/files/XM6VmDznx6e0n3iJP7qR" alt=""><figcaption><p>Lookups - Preview data</p></figcaption></figure>
{% endtab %}

{% tab title="3. Calculator" %}
{% hint style="info" %}

#### Calculator

The Calculator step provides predefined functions that you can run on input field values. Use Calculator as a quick alternative to custom JavaScript for common calculations.

To use Calculator, specify the input fields and the calculation type, and then write results to new fields. You can also remove temporary fields from the output after all values are calculated.
{% endhint %}

<figure><img src="/files/kcC0MNGKYV05apB6LLlr" alt=""><figcaption><p>Calculator step</p></figcaption></figure>

1. Drag & drop a 'Calculator' step onto the canvas.
2. Draw a Hop from the 'Customers Lookup' step to the 'Calculator' step.
3. Double-click on the 'Calculator' step, and configure the following properties:

| New field       | Calculation | Field A      | Field B     | Value type |
| --------------- | ----------- | ------------ | ----------- | ---------- |
| `line_total`    | A \* B      | quantity     | unit\_price | Number     |
| `profit_margin` | A - B       | sale\_amount | line\_total | Number     |

<figure><img src="/files/gmhpU8D2UrK42NKhNW7J" alt=""><figcaption><p>Calculator</p></figcaption></figure>

***

**Preview data**

1. Save the transformation.
2. RUN & Preview the data.

<figure><img src="/files/umXQ3OizRTK7sDhs9tx2" alt=""><figcaption><p>Preview data</p></figcaption></figure>

{% hint style="info" %}
**Business Insight Enabled:**

* **Positive discount\_amount:** Customer received a discount (common)
* **Negative discount\_amount:** Customer paid MORE than catalog price (premium service, expedited shipping, etc.)
* **Zero discount\_amount:** Sold at list price
  {% endhint %}
  {% endtab %}

{% tab title="4. Formula" %}
{% hint style="info" %}

#### Formula

The Formula step can calculate Formula Expressions within a data stream. It can be used to create simple calculations like \[A]+\[B] or more complex business logic with a lot of nested if / then logic.
{% endhint %}

<figure><img src="/files/x9jwLThDa8iTJKxTRrqk" alt=""><figcaption><p>Formula step</p></figcaption></figure>

1. Drag & drop a 'Formula' step onto the canvas.
2. Draw a Hop from the 'Calculator' step to the 'Formula' step.
3. Double-click on the 'Formula' step, and configure the following properties:

<table><thead><tr><th width="190">New Field</th><th>Formula</th></tr></thead><tbody><tr><td>customer_full_name</td><td>CONCATENATE([first_name];" ";[last_name])</td></tr><tr><td>is_high_value</td><td>IF([sale_amount]>500;"Yes";"No")</td></tr></tbody></table>

<figure><img src="/files/IDPxHR8DMB4M7okF6lLM" alt=""><figcaption><p>Formula step</p></figcaption></figure>

***

**Preview data**

1. Save the transformation.
2. RUN & Preview the data.

<figure><img src="/files/WJcrQDdi4mTrQb6Gzz8t" alt=""><figcaption><p>Preview data</p></figcaption></figure>

{% hint style="info" %}
**Business Applications:**

* **is\_high\_value:** Trigger VIP customer service workflows
* **discount\_percentage:** Measure promotion effectiveness by channel
* **payment\_risk:** Flag transactions for fraud review
  {% endhint %}
  {% endtab %}

{% tab title="5. Add Constants" %}
{% hint style="info" %}

#### Add Constants

The Add constant values step is a simple and high performance way to add constant values to the stream.
{% endhint %}

<figure><img src="/files/MSY8dJUow1gXzlSSRWTK" alt=""><figcaption><p>Add constants</p></figcaption></figure>

1. Drag & drop 'Add constants' step onto the canvas.
2. Draw a Hop from the 'Formula' step to the 'Add constants ' step.
3. Double-click on the 'Add constants' step, and configure the following properties:

| Name          | Type   | Value            |
| ------------- | ------ | ---------------- |
| `data_source` | String | `minio_workshop` |

<figure><img src="/files/KGpyhLd8Ie1QzPKkKVQ6" alt=""><figcaption><p>Add constants</p></figcaption></figure>
{% endtab %}

{% tab title="6. Get System info" %}
{% hint style="info" %}

#### Get system info

This step retrieves system information from the Kettle environment. The step includes a table where you can designate a name and assign it to any available system info type you want to retrieve. This step generates a single row with the fields containing the requested information.

It can also accept any number of input streams, aggregate any fields defined by this step, and send the combined results to the output stream.
{% endhint %}

<figure><img src="/files/WjxXrhIllYmI5kykNkrw" alt=""><figcaption><p>get system info</p></figcaption></figure>

1. Drag & drop 'Get system info' step onto the canvas.
2. Draw a Hop from the 'Add constants' step to the 'Get system info ' step.
3. Double-click on the 'Add constants' step, and configure the following properties:

| Name           | Type                   |
| -------------- | ---------------------- |
| etl\_timestamp | system date (variable) |

<figure><img src="/files/NUKwwczMuewFlAqcKASJ" alt=""><figcaption><p>Get system info</p></figcaption></figure>
{% endtab %}

{% tab title="7. Select Values" %}
{% hint style="info" %}

#### **Select Values**

The Select Values step can perform all the following actions on fields in the PDI stream:

**Select fields** - The Select Values step can perform all the following actions on fields in the PDI stream.

**Remove fields** - Use this tab to remove fields from the input stream.

**Meta-data** - Use this tab to remove fields from the input stream.
{% endhint %}

<figure><img src="/files/pRqzefMgYCnDit47qlS6" alt=""><figcaption><p>Select values</p></figcaption></figure>

1. Drag & drop a 'Select values' step onto the canvas.
2. Draw a Hop from the 'Get system info' step to the 'Select values' step.
3. Double-click on the 'Select values' step, and configure the following properties:
4. On **Select & Alter** tab, choose fields in order:

* sale\_id
* sale\_date
* customer\_id
* customer\_full\_name
* customer\_country
* customer\_status
* product\_id
* product\_name
* product\_category
* quantity
* unit\_price
* sale\_amount
* line\_total
* profit\_margin
* is\_high\_value
* payment\_method
* status (rename to `sale_status`)
* etl\_timestamp
* data\_source

<figure><img src="/files/pp1Byq5JvAmtFst7wlkI" alt=""><figcaption><p>Select</p></figcaption></figure>

***

**Preview data**

1. Save the transformation.
2. RUN & Preview the data.

<figure><img src="/files/hslHulDBTUZJQhDOADGn" alt=""><figcaption><p>Preview data</p></figcaption></figure>
{% endtab %}

{% tab title="8. Text File Output" %}
{% hint style="info" %}

#### Text file output

The Text File Output step exports rows to a text file.

This step is commonly used to generate delimited files (for example, CSV) that can be read by spreadsheet applications, and it can also generate fixed-length output.

You can’t run this step in parallel to write to the same file.

If you need to run multiple copies, select Include stepnr in filename and merge the resulting files afterward.
{% endhint %}

<figure><img src="/files/91XvtGEsAWMXwgWZGCOm" alt=""><figcaption><p>Text File output</p></figcaption></figure>

1. Drag & drop a 'Select values' step onto the canvas.
2. Draw a Hop from the 'Select values' step to the 'Write to staging' step.
3. Double-click on the 'Write to staging' step, and configure with the following properties:

| Setting                       | Value                                       |
| ----------------------------- | ------------------------------------------- |
| Step name                     | `Write to Staging`                          |
| Filename                      | `pvfs://MinIO/staging/dashboard/sales_fact` |
| Extension                     | `csv`                                       |
| Include date/time in filename | ✅                                           |
| Separator                     | ,                                           |
| Add header                    | ✅                                           |
|                               |                                             |

{% hint style="warning" %}
Remember to: Get Fields
{% endhint %}

{% hint style="info" %}
**Business Benefit:** Timestamped files enable:

* **Historical tracking:** "What did the data look like last Tuesday?"
* **Incremental processing:** Keep processing latest file without overwriting history
* **Rollback capability:** "The 3pm run had bad data, revert to 2pm version"
  {% endhint %}

***

**MinIO**

1. Sve the transformation.
2. Log into MinIO:

<figure><img src="/files/whbPHxeIYRXF1r7KyWhh" alt=""><figcaption><p>MinIO - Dashboard data</p></figcaption></figure>

***

**Checklist**

* [ ] Three Text file inputs configured (reading CSV from S3)
* [ ] Product lookup working (no null product names)
* [ ] Customer lookup working (no null countries)
* [ ] Calculations producing correct values
* [ ] Fields in correct order
* [ ] Output file created in staging bucket
* [ ] All 15 sales records processed
  {% endtab %}
  {% endtabs %}
  {% endtab %}

{% tab title="Inventory Reconciliation" %}
{% hint style="warning" %}

#### Inventory Reconciliation - XML + CSV Integration

This workshop demonstrates how Pentaho Data Integration eliminates costly inventory discrepancies by automatically reconciling data between warehouse management systems (XML feeds) and ERP product catalogs (CSV files). Organizations lose millions annually due to inventory inaccuracies, stockouts, and overstocking. PDI's ability to parse complex XML and perform full outer joins enables real-time discrepancy detection that would require hours of manual spreadsheet work.

**Business Value Delivered:**

* **Cost Reduction:** Eliminate manual reconciliation labor ($75K-150K annually per analyst)
* **Inventory Optimization:** Reduce excess inventory carrying costs by 15-25%
* **Stockout Prevention:** Identify missing items before customers notice
* **Compliance:** Audit trail for SOX, ISO 9001, and supply chain regulations
* **Real-Time Visibility:** Know your actual inventory position within minutes, not days

**Scenario:** A manufacturing company operates 12 distribution warehouses. Each warehouse uses a legacy WMS (Warehouse Management System) that exports XML inventory files nightly. The corporate ERP system maintains a CSV product master catalog. Discrepancies cause:

* **Phantom stock:** ERP shows item in stock, warehouse says it's not → Lost sales
* **Ghost inventory:** Warehouse has items ERP doesn't recognize → Dead capital
* **Quantity variances:** Mismatches of 10+ units trigger expensive physical counts

**Key Stakeholders:**

* **Supply Chain Directors:** Need accurate inventory positions across all locations
* **Warehouse Managers:** Require daily reconciliation reports to prioritize cycle counts
* **Finance Teams:** Must report accurate inventory valuations for financial statements
* **Procurement:** Need to identify slow-moving items and prevent overstocking
  {% endhint %}

<figure><img src="/files/iMGHIMSukH4yCfdIN32J" alt=""><figcaption><p>Inventory Conciliation</p></figcaption></figure>

Follow the steps to create the transformation:

{% tabs %}
{% tab title="1. Get data from XML" %}
{% hint style="info" %}

#### Get data form XML

{% endhint %}

x

1. Drag & drop 'Get data from XML' onto the canvas.
2. Save transformation as: `sales_dashboard_etl.ktr` in your workshop folder.
3. Double-click on the 'Get data from XML' step, and configure with the following properties:

<table><thead><tr><th width="186">Setting</th><th>Value</th></tr></thead><tbody><tr><td>Step name</td><td>Read Warehouse XML</td></tr><tr><td>File or directory</td><td><code>pvfs://MinIO/raw-data/xml/inventory.xml</code></td></tr><tr><td>Loop XPath</td><td><code>/inventory/items/item</code></td></tr><tr><td>Encoding</td><td><code>UTF-8</code></td></tr><tr><td>Ignore comments</td><td>✅</td></tr><tr><td>Validate XML</td><td>No</td></tr><tr><td>Ignore empty file</td><td>✅</td></tr></tbody></table>

{% hint style="info" %}
**XPath Explanation:**

* `/inventory` = Start at root element
* `/items` = Navigate to items container
* `/item` = Loop over each item element
  {% endhint %}

4. Browse & Add the path to the inventory.xml

x

5. Click on the Content tab

<figure><img src="/files/kCiQo09ujNftYaSxbWM2" alt=""><figcaption><p>Configure XPath</p></figcaption></figure>

6. Click on the Fields tab & Get Fields.
7. Remap the fields & Preview rows.

{% hint style="info" %}
**Business Field Naming:**

* Prefix with `warehouse_` to distinguish from ERP fields later
* `warehouse_quantity` vs. `stock_quantity` makes joins clearer
* Keep original field names in a data dictionary for auditing
  {% endhint %}

| Name                  | XPath         |
| --------------------- | ------------- |
| warehouse\_item\_name | name          |
| warehouse\_quantity   | quantity      |
| warehouse\_location   | location      |
| last\_physical\_count | last\_checked |

<figure><img src="/files/WCmT4hfNb5jGeyUaxRWh" alt=""><figcaption><p>Remap field names &#x26; Preview data</p></figcaption></figure>

7.

x

x

x

x

x
{% endtab %}

{% tab title="Second Tab" %}
x
{% endtab %}
{% endtabs %}
{% endtab %}

{% tab title="Customer 360" %}
{% hint style="warning" %}

#### Customer 360

Create unified customer profiles combining demographic data, purchase history, and behavioral events.

**Skills:** Multiple joins, JSONL parsing, aggregations, calculated metrics
{% endhint %}

<figure><img src="/files/RF3rEFvMNBDxwjiKGcuB" alt=""><figcaption><p>Customer 360</p></figcaption></figure>

x

x

{% tabs %}
{% tab title="1. Customers stream" %}
{% hint style="info" %}

#### Text file input

The Text File Output step exports rows to a text file.

This step is commonly used to generate delimited files (for example, CSV) that can be read by spreadsheet applications, and it can also generate fixed-length output.

You can’t run this step in parallel to write to the same file.

If you need to run multiple copies, select Include stepnr in filename and merge the resulting files afterward.
{% endhint %}

x

1. Drag & drop 'Text file input' steps onto the canvas.
2. Save transformation as: `customer_360.ktr` in your workshop folder.

***

**Sales (Order Management)**

1. Double-click on the first TFI step, and configure with the following properties:

| Setting          | Value                                 |
| ---------------- | ------------------------------------- |
| Step name        | `Sales`                               |
| Filename         | `pvfs://Minio/raw-data/csv/sales.csv` |
| Delimiter        | ,                                     |
| Head row present | ✅                                     |
| Format           | mixed                                 |

<figure><img src="/files/XlXKeRhImBeHbuaSmdUZ" alt=""><figcaption><p>Select - sales.csv from VFS connections</p></figcaption></figure>

2. Click: **Get Fields** to auto-detect columns.

{% hint style="info" %}
**Business Logic:** Note that `sale_amount` may differ from `price * quantity` due to:

* Volume discounts
* Promotional pricing
* Customer-specific pricing tiers
* Currency conversion (for international sales)
  {% endhint %}

<figure><img src="/files/nLGRIikQYnpXPcuFjQy7" alt=""><figcaption><p>Get Fields - Sales</p></figcaption></figure>

3. Preview data.

<figure><img src="/files/RNrGgMfChgJ6FwVj3Qzh" alt=""><figcaption><p>Preview data - Sales</p></figcaption></figure>

{% hint style="info" %}
**Business Significance:**

* `sale_amount`: Actual revenue (may include discounts)
* `quantity`: Volume metrics for demand planning
* `payment_method`: Payment preference insights
* `status`: Filter out cancelled/refunded orders
  {% endhint %}
  {% endtab %}

{% tab title="2. Sales Stream" %}
{% hint style="info" %}

#### Sort

{% endhint %}

{% hint style="info" %}

#### Group by

{% endhint %}

x

x
{% endtab %}

{% tab title="3. Events stream" %}
{% hint style="info" %}

#### Text file input

{% endhint %}

x

x
{% endtab %}

{% tab title="4. Joins" %}

{% endtab %}

{% tab title="5. Metrics" %}

{% endtab %}
{% endtabs %}
{% endtab %}

{% tab title="Log Analysis" %}
{% hint style="warning" %}

#### Log Parsing and Anomaly Detection

**Objective:** Parse application logs, extract metrics, and detect anomalies.

**Skills:** Regex, timestamp parsing, time-series analysis, conditional logic
{% endhint %}

<figure><img src="/files/AeSI34E4B158rfBbRU6g" alt=""><figcaption><p>Log Analysis</p></figcaption></figure>

x

x

{% tabs %}
{% tab title="First Tab" %}
x
{% endtab %}

{% tab title="Second Tab" %}
x
{% endtab %}
{% endtabs %}

x
{% endtab %}

{% tab title="Fraud Detection" %}
{% hint style="warning" %}

#### Transactions & Fraud Detection

**Objective:** Process credit card transactions, enrich with account and merchant data, calculate transaction metrics, and detect suspicious patterns using rule-based fraud detection.

**Skills:** Financial data processing, multi-table joins, running totals, rule-based fraud detection, transaction velocity analysis

**Business Context:** A payment processor needs to analyze transaction data in real-time to detect potentially fraudulent activity before authorizing transactions. The system must flag high-risk transactions based on amount thresholds, unusual merchant activity, account balance checks, and transaction velocity patterns.
{% endhint %}

x

x

{% tabs %}
{% tab title="1. Financial Data stream" %}
{% hint style="info" %}

#### Financial Data

{% endhint %}

x

x

x

x

x
{% endtab %}

{% tab title="2. Joins" %}
x

x

x

x

x

x
{% endtab %}

{% tab title="3. Fraud Detection" %}
x

x

x

x

xx

x
{% endtab %}
{% endtabs %}
{% endtab %}

{% tab title="Data Lake Ingestion" %}
{% hint style="warning" %}

#### Data Lake Ingestion

Modern data lakes often receive the same entities (products, customers, orders) from multiple sources in different formats. This workshop demonstrates how to ingest, normalize, validate, and deduplicate multi-format data into a unified schema - a common data engineering pattern.

**Objective:** Combine data from CSV, JSON, and XML into a unified product schema.

**Skills:** Multi-format parsing, schema normalization, data validation, deduplication
{% endhint %}

x

x

{% tabs %}
{% tab title="1. Define Target Schema" %}
{% hint style="info" %}

#### Define Target Schema

**Objective:** Design a unified schema that accommodates all source formats.

**Why Important:** Before ingesting data, you need a clear target schema. This ensures consistency across all sources and makes downstream analytics easier.
{% endhint %}

x

<table data-full-width="true"><thead><tr><th width="141">Field</th><th width="109">Type</th><th width="95">Length</th><th width="125">Description</th><th>Source Mapping</th></tr></thead><tbody><tr><td>product_id</td><td>String</td><td>50</td><td>Unique product identifier</td><td>CSV: product_id<br>JSON: product_id<br>XML: sku</td></tr><tr><td>product_name</td><td>String</td><td>200</td><td>Product display name</td><td>CSV: product_name<br>JSON: product_name<br>XML: name</td></tr><tr><td>category</td><td>String</td><td>100</td><td>Product category</td><td>CSV: category<br>JSON: (derived from order type)<br>XML: category</td></tr><tr><td>price</td><td>Number</td><td>15,2</td><td>Unit price in USD</td><td>CSV: price<br>JSON: unit_price<br>XML: null (not available)</td></tr><tr><td>quantity</td><td>Integer</td><td>10</td><td>Available stock quantity</td><td>CSV: stock_quantity<br>JSON: quantity<br>XML: quantity</td></tr><tr><td>source_system</td><td>String</td><td>10</td><td>Origin system identifier</td><td>Constant: 'csv', 'json', or 'xml'</td></tr><tr><td>ingestion_time</td><td>Timestamp</td><td>-</td><td>When record was ingested</td><td>System timestamp</td></tr></tbody></table>

x

x

{% tabs %}
{% tab title="1. Schema Discovery & Analysis" %}
{% hint style="info" %}

#### Schema Discovery & Analysis

**Objective:** Understand each source structure before you design the target schema.

**Why it matters:** You can’t normalize what you haven’t inspected.
{% endhint %}

{% stepper %}
{% step %}
**Inspect each source**

Use real samples. Avoid guessing field names.

{% tabs %}
{% tab title="CSV (products.csv)" %}
{% code title="Inspect the file" %}

```bash
mc cat minio-local/raw-data/csv/products.csv | head -5
```

{% endcode %}

{% code title="Sample output" %}

```csv
product_id,product_name,category,price,stock_quantity
PROD-001,Laptop Pro 15,Electronics,999.99,50
PROD-002,Office Chair,Furniture,299.99,100
PROD-003,Coffee Maker,Appliances,79.99,200
```

{% endcode %}

**Findings**

* Has `product_id`, `product_name`, `category`, `price`, `stock_quantity`.
* Completeness looks high.
* Naming is consistent and explicit.
  {% endtab %}

{% tab title="JSON (api\_response.json)" %}
{% code title="Inspect one nested item" %}

```bash
mc cat minio-local/raw-data/json/api_response.json | jq '.data.orders[0].items[0]'
```

{% endcode %}

{% code title="Sample output" %}

```json
{
  "product_id": "PROD-001",
  "product_name": "Laptop Pro 15",
  "unit_price": 999.99,
  "quantity": 2
}
```

{% endcode %}

**Findings**

* Has `product_id` and `product_name`.
* Uses `unit_price` instead of `price`.
* `quantity` is order quantity, not stock.
* `category` is missing.
* Path is `$.data.orders[*].items[*]`.
  {% endtab %}

{% tab title="XML (inventory.xml)" %}
{% code title="Inspect one item node" %}

```bash
mc cat minio-local/raw-data/xml/inventory.xml | grep -A 6 "<item>" | head -10
```

{% endcode %}

{% code title="Sample output" %}

```xml
<item>
  <sku>PROD-001</sku>
  <name>Laptop Pro 15</name>
  <category>Electronics</category>
  <quantity>50</quantity>
  <location>A-15</location>
</item>
```

{% endcode %}

**Findings**

* Uses `sku` for `product_id`.
* Uses `name` for `product_name`.
* Has `category` and warehouse `quantity`.
* `price` is missing.
* `location` is extra for a product master.
  {% endtab %}
  {% endtabs %}
  {% endstep %}

{% step %}
**Build a field mapping matrix**

This shows name differences and missing fields.

<table data-full-width="true"><thead><tr><th>Unified field</th><th>CSV</th><th>JSON</th><th>XML</th><th>Notes</th></tr></thead><tbody><tr><td>Identifier</td><td><code>product_id</code></td><td><code>product_id</code></td><td><code>sku</code></td><td>Same meaning. Different name in XML.</td></tr><tr><td>Name</td><td><code>product_name</code></td><td><code>product_name</code></td><td><code>name</code></td><td>Same meaning. Different name in XML.</td></tr><tr><td>Category</td><td><code>category</code></td><td>❌</td><td><code>category</code></td><td>Missing in JSON.</td></tr><tr><td>Price</td><td><code>price</code></td><td><code>unit_price</code></td><td>❌</td><td>Different name in JSON. Missing in XML.</td></tr><tr><td>Stock quantity</td><td><code>stock_quantity</code></td><td><code>quantity</code></td><td><code>quantity</code></td><td>JSON <code>quantity</code> is not stock.</td></tr></tbody></table>

**What to watch**

* Missing data is normal in multi-source ingestion.
* Same name can mean different things.
  {% endstep %}

{% step %}
**Make schema decisions**

Write these down. You will forget them later.

**Field names**

* Use CSV naming as the standard.
* Map XML `sku → product_id` and `name → product_name`.
* Map JSON `unit_price → price`.

**Missing fields**

* Missing `category` in JSON: set a default like `E-commerce`.
* Missing `price` in XML: leave `NULL`.

**Data types**

* `product_id`: string. It contains `PROD-` prefix.
* `product_name`: string. Allow up to 200 chars.
* `category`: string. Allow up to 100 chars.
* `price`: decimal(15,2).
* `quantity`: integer.

**Metadata**

* Add `source_system` for lineage.
* Add `ingestion_time` for auditability.
  {% endstep %}

{% step %}
**Define a deduplication rule**

Same `product_id` can appear in multiple sources.

{% code title="Example collision" %}

```
CSV:  PROD-001, price=999.99, stock_quantity=50, category=Electronics
JSON: PROD-001, price=999.99, quantity=2,       category=NULL
XML:  PROD-001, price=NULL,   quantity=50,      category=Electronics
```

{% endcode %}

**Recommended rule**

1. Prefer CSV.
2. Then JSON.
3. Then XML.

Implement this with `source_priority` (CSV=1, JSON=2, XML=3).
{% endstep %}

{% step %}
**Checklist**

* You inspected real records for each source.
* You captured paths for nested formats.
* You documented mappings and type choices.
* You decided how to handle missing data.
* You decided how to dedupe collisions.
  {% endstep %}
  {% endstepper %}
  {% endtab %}

{% tab title="Second Tab" %}
x
{% endtab %}
{% endtabs %}
{% endtab %}

{% tab title="2. Ingest Datasources" %}
x

x

#### Step 2: Ingest CSV Products

**Objective:** Read CSV products and map to target schema.

**Why CSV First:** CSV is the simplest format and requires minimal transformation - good for testing your target schema.

**Configuration:**

1. **Add Text file input step**
   * **Name**: "Read CSV Products"
   * **File/directory**: `pvfs://MinIO/raw-data/csv/products.csv`
   * **Separator**: Comma (,)
   * **Enclosure**: " (double quote)
   * **Header**: ☑ Header row present
2. **Fields tab** (click "Get Fields"):

   | Name            | Type    | Format | Length | Precision |
   | --------------- | ------- | ------ | ------ | --------- |
   | product\_id     | String  |        | 50     |           |
   | product\_name   | String  |        | 200    |           |
   | category        | String  |        | 100    |           |
   | price           | Number  | #.##   | 15     | 2         |
   | stock\_quantity | Integer |        | 10     |           |
3. **Add Select values step**
   * **Name**: "Map CSV to Target Schema"
4. **Select & Alter tab** - Rename fields to match target:

   | Fieldname (from previous) | Rename to     | Type    | Length | Precision |
   | ------------------------- | ------------- | ------- | ------ | --------- |
   | product\_id               | product\_id   | String  | 50     |           |
   | product\_name             | product\_name | String  | 200    |           |
   | category                  | category      | String  | 100    |           |
   | price                     | price         | Number  | 15     | 2         |
   | stock\_quantity           | quantity      | Integer | 10     |           |
5. **Add Add constants step**
   * **Name**: "Add CSV Metadata"
6. **Fields tab**:

   | Field name     | Type   | Value |
   | -------------- | ------ | ----- |
   | source\_system | String | csv   |
7. **Add Get System Info step**
   * **Name**: "Add Ingestion Timestamp"
8. **Fields tab**:

   | Name            | Type                   |
   | --------------- | ---------------------- |
   | ingestion\_time | system date (variable) |

**Expected Output (Preview):**

```
product_id   product_name      category      price   quantity  source_system  ingestion_time
PROD-001     Laptop Pro 15     Electronics   999.99  50        csv            2024-01-23 10:30:45
PROD-002     Office Chair      Furniture     299.99  100       csv            2024-01-23 10:30:45
PROD-003     Coffee Maker      Appliances    79.99   200       csv            2024-01-23 10:30:45
```

**Row Count:** 12 products from CSV

#### Step 3: Ingest JSON Products

**Objective:** Extract product data from nested JSON structure.

**Why More Complex:** JSON often contains nested structures. You need to use JSONPath to navigate to the data you want.

**JSON Structure Overview:**

```json
{
  "data": {
    "orders": [
      {
        "order_id": "ORD-001",
        "items": [
          {
            "product_id": "PROD-001",
            "product_name": "Laptop Pro 15",
            "unit_price": 999.99,
            "quantity": 2
          }
        ]
      }
    ]
  }
}
```

**JSONPath:** `$.data.orders[*].items[*]` extracts all items from all orders.

**Configuration:**

1. **Add JSON Input step**
   * **Name**: "Read JSON Products"
   * **File tab**:
     * **File or directory**: `pvfs://MinIO/raw-data/json/api_response.json`
     * **Include subfolders**: ☐ No
2. **Content tab**:
   * **Source is defined in a field**: ☐ No
   * **Source is a URL**: ☐ No
   * **Ignore empty file**: ☑ Yes
   * **Do not raise error if no files**: ☐ No
   * **Limit**: 0 (no limit)
3. **Fields tab**:

   Click **Select fields** and set JSONPath:

   | Name          | Path            | Type    | Length | Precision |
   | ------------- | --------------- | ------- | ------ | --------- |
   | product\_id   | $.product\_id   | String  | 50     |           |
   | product\_name | $.product\_name | String  | 200    |           |
   | unit\_price   | $.unit\_price   | Number  | 15     | 2         |
   | quantity      | $.quantity      | Integer | 10     |           |

   **Important:** The base path `$.data.orders[*].items[*]` is entered in the **Content tab → Path** field (if available in your PDI version), or you use full paths like `$.data.orders[*].items[*].product_id`
4. **Add Select values step**
   * **Name**: "Map JSON to Target Schema"
5. **Select & Alter tab**:

   | Fieldname     | Rename to     | Type    | Length | Precision |
   | ------------- | ------------- | ------- | ------ | --------- |
   | product\_id   | product\_id   | String  | 50     |           |
   | product\_name | product\_name | String  | 200    |           |
   | unit\_price   | price         | Number  | 15     | 2         |
   | quantity      | quantity      | Integer | 10     |           |
6. **Add Add constants step**
   * **Name**: "Add JSON Metadata"
7. **Fields tab**:

   | Field name     | Type   | Value      |
   | -------------- | ------ | ---------- |
   | source\_system | String | json       |
   | category       | String | E-commerce |

   **Note:** JSON doesn't have category, so we set a default value "E-commerce"
8. **Add Get System Info step**
   * **Name**: "Add JSON Ingestion Timestamp"
   * Add field: `ingestion_time` → Type: `system date (variable)`

**Expected Output (Preview):**

```
product_id   product_name      category      price   quantity  source_system  ingestion_time
PROD-001     Laptop Pro 15     E-commerce    999.99  2         json           2024-01-23 10:30:46
PROD-005     Desk Lamp         E-commerce    45.00   3         json           2024-01-23 10:30:46
PROD-007     USB-C Cable       E-commerce    19.99   5         json           2024-01-23 10:30:46
```

**Row Count:** \~10-15 product entries (some may be duplicates from different orders)

#### Step 4: Ingest XML Products

**Objective:** Extract product data from XML using XPath.

**Why Different:** XML uses hierarchical structure with tags. XPath (like SQL for XML) lets you query specific elements.

**XML Structure Overview:**

```xml
<?xml version="1.0" encoding="UTF-8"?>
<inventory>
  <warehouse>Warehouse A</warehouse>
  <items>
    <item>
      <sku>PROD-001</sku>
      <name>Laptop Pro 15</name>
      <category>Electronics</category>
      <quantity>50</quantity>
      <location>A-15</location>
    </item>
    <item>
      <sku>PROD-002</sku>
      <name>Office Chair</name>
      <category>Furniture</category>
      <quantity>100</quantity>
      <location>B-23</location>
    </item>
  </items>
</inventory>
```

**XPath:** `/inventory/items/item` selects all `<item>` nodes

**Configuration:**

1. **Add Get data from XML step**
   * **Name**: "Read XML Products"
2. **File tab**:
   * **File or directory**: `pvfs://MinIO/raw-data/xml/inventory.xml`
   * **Include subfolders**: ☐ No
3. **Content tab**:
   * **Loop XPath**: `/inventory/items/item`
   * **Encoding**: UTF-8
   * **Namespace aware**: ☐ No (unless XML has namespaces)
   * **Ignore comments**: ☑ Yes
   * **Validate**: ☐ No
4. **Fields tab** - Define fields to extract:

   | Name     | XPath    | Element type | Type    | Length | Format |
   | -------- | -------- | ------------ | ------- | ------ | ------ |
   | sku      | sku      | Element      | String  | 50     |        |
   | name     | name     | Element      | String  | 200    |        |
   | category | category | Element      | String  | 100    |        |
   | quantity | quantity | Element      | Integer | 10     |        |

   **XPath Tips:**

   * Use relative paths from the Loop XPath
   * `sku` means "look for `<sku>` child element"
   * For attributes, use `@attribute_name`
   * For nested elements, use `parent/child`
5. **Add Select values step**
   * **Name**: "Map XML to Target Schema"
6. **Select & Alter tab**:

   | Fieldname | Rename to     | Type    | Length | Precision |
   | --------- | ------------- | ------- | ------ | --------- |
   | sku       | product\_id   | String  | 50     |           |
   | name      | product\_name | String  | 200    |           |
   | category  | category      | String  | 100    |           |
   | quantity  | quantity      | Integer | 10     |           |
7. **Add Add constants step**
   * **Name**: "Add XML Metadata"
8. **Fields tab**:

   | Field name     | Type   | Value |
   | -------------- | ------ | ----- |
   | source\_system | String | xml   |
   | price          | Number | null  |

   **Note:** XML inventory doesn't have price data (warehouse doesn't track retail prices), so we explicitly set it to null
9. **Add Get System Info step**
   * **Name**: "Add XML Ingestion Timestamp"
   * Add field: `ingestion_time` → Type: `system date (variable)`

**Expected Output (Preview):**

```
product_id   product_name      category      price   quantity  source_system  ingestion_time
PROD-001     Laptop Pro 15     Electronics   null    50        xml            2024-01-23 10:30:47
PROD-002     Office Chair      Furniture     null    100       xml            2024-01-23 10:30:47
PROD-004     Monitor 27"       Electronics   null    75        xml            2024-01-23 10:30:47
```

**Row Count:** \~8-10 warehouse inventory items

**Common XML Troubleshooting:**

* If no rows returned: Check Loop XPath is correct
* If empty values: Verify field XPaths match element names (case-sensitive)
* If namespace errors: Try checking "Ignore namespace" option
  {% endtab %}

{% tab title="3. Merge streams" %}
{% hint style="info" %}

#### Merge Streams

**Objective:** Merge all three data streams (CSV, JSON, XML) into one unified stream.

**Why Append Streams:** This step stacks all rows from different sources vertically - like a SQL UNION ALL.
{% endhint %}

**Configuration:**

1. **Add Append streams step**
   * **Name**: "Combine All Products"
2. **Connect all three streams** to this step:
   * "Add Ingestion Timestamp" (CSV branch) → Append streams
   * "Add JSON Ingestion Timestamp" (JSON branch) → Append streams
   * "Add XML Ingestion Timestamp" (XML branch) → Append streams
3. **Important:** All input streams MUST have the same fields with the same names and types:
   * product\_id (String)
   * product\_name (String)
   * category (String)
   * price (Number) - can be null
   * quantity (Integer)
   * source\_system (String)
   * ingestion\_time (Timestamp)

**Expected Output:**

* Row count: \~30-35 rows (12 CSV + 10-15 JSON + 8-10 XML)
* All products from all sources combined
* Some products will appear multiple times (duplicates to be handled in Step 7)

**Preview Check:**

```
product_id   product_name      source_system  price
PROD-001     Laptop Pro 15     csv            999.99
PROD-002     Office Chair      csv            299.99
...
PROD-001     Laptop Pro 15     json           999.99   ← Duplicate!
PROD-005     Desk Lamp         json           45.00
...
PROD-001     Laptop Pro 15     xml            null     ← Duplicate, no price
PROD-002     Office Chair      xml            null
```

x
{% endtab %}

{% tab title="4. Data Validation" %}
{% hint style="info" %}

#### Data Validation

**Objective:** Validate data quality and route bad records to error handling.

**Why Important:** Multi-source data often has quality issues. Better to catch and handle them explicitly than have them cause downstream failures.
{% endhint %}

**Configuration:**

1. **Add Data Validator step**
   * **Name**: "Validate Product Data"
2. **Validations tab** - Add validation rules:

   | Fieldname     | Validation Type  | Configuration       | Error Message                   |
   | ------------- | ---------------- | ------------------- | ------------------------------- |
   | product\_id   | NOT NULL         |                     | Product ID is required          |
   | product\_id   | NOT EMPTY STRING |                     | Product ID cannot be empty      |
   | product\_name | NOT NULL         |                     | Product name is required        |
   | product\_name | NOT EMPTY STRING |                     | Product name cannot be empty    |
   | price         | NUMERIC RANGE    | Min: 0, Max: 999999 | Price must be >= 0 (if present) |
   | quantity      | NUMERIC RANGE    | Min: 0, Max: 999999 | Quantity must be >= 0           |
3. **Options tab**:
   * ☑ **Concatenate errors**: Shows all validation errors for a row
   * **Separator**: `,` (comma-space)
   * ☑ **Output all errors as one field**: `validation_errors`
4. **Add Filter rows step** after Data Validator
   * **Name**: "Route Valid vs Invalid"
5. **Condition**:

   ```
   validation_errors IS NULL
   ```

   * **True** (valid records) → Continue to deduplication
   * **False** (invalid records) → Error output
6. **Add Text file output for errors** (connect from False branch):
   * **Name**: "Write Error Records"
   * **Filename**: `pvfs://MinIO/curated/products/errors/validation_errors_${Internal.Job.Start.Date.yyyyMMdd}.csv`
   * **Include date in filename**: Helps track when errors occurred
   * **Fields to output**: All fields + `validation_errors`

**Expected Output:**

* Valid records: \~95-100% should pass (25-35 rows)
* Invalid records: 0-5% to error file (0-2 rows)

**Common Validation Failures:**

* Empty product\_id or product\_name
* Negative price or quantity values
* Non-numeric values in numeric fields

x

x

x
{% endtab %}
{% endtabs %}
{% endtab %}
{% endtabs %}

x
{% endtab %}

{% tab title="Windows" %}
{% hint style="info" %}
Installs and configures MinIO on Windows 11 running in Docker Desktop.
{% endhint %}

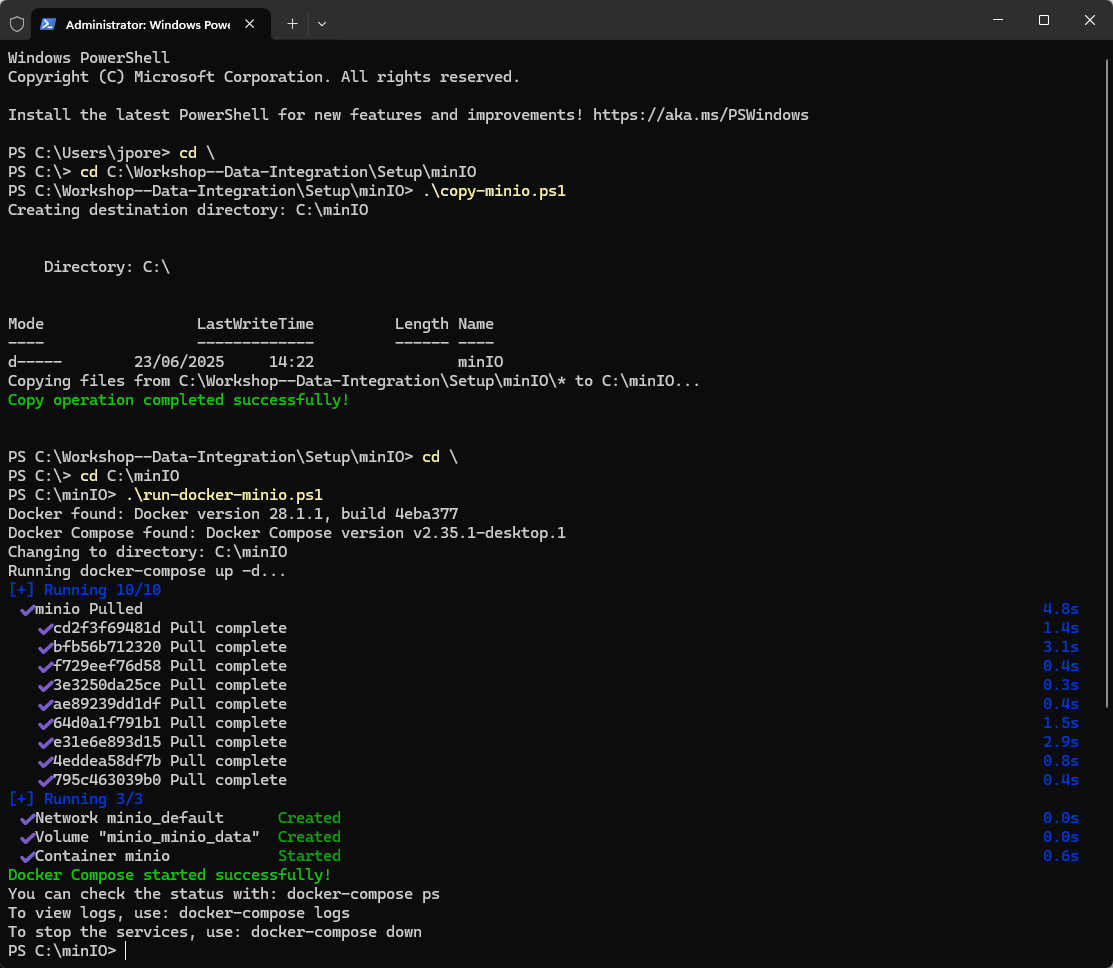
1. Create a MinIO folder and copy the required files.

{% hint style="info" %}
**Create directory & copy**

```powershell
cd \
cd C:\Workshop--Data-Integration\Setup\MinIO\windows
.\copy-minio.ps1
```

{% endhint %}

2. Check the Directory has been created and the files copied over.
3. Execute the docker-compose script to create the container.

{% hint style="info" %}
**MinIO Container**

```powershell
cd \
cd C:\MinIO
.\run-docker-minio.ps1
```

{% endhint %}

<figure><img src="/files/hz1UPT961EEI0TQ5rpHA" alt=""><figcaption><p>Deploy minIO.</p></figcaption></figure>

4. Check the container is up and running in Desktop Docker.

<figure><img src="/files/titANFBwCV24nTmi1j6R" alt=""><figcaption></figcaption></figure>

5. Access MinIO UI:

Username: minioadmin

Password: minioadmin

{% embed url="<http://localhost:9000>" %}

<figure><img src="/files/Y1aijTnwGBAgAP673vVB" alt=""><figcaption><p>MinIO UI.</p></figcaption></figure>

{% hint style="danger" %}
The MinIO port has been changed to prevent conflicts.
{% endhint %}
{% endtab %}

{% tab title="Sample Data" %}
{% hint style="info" %}
The population scripts create realistic datasets in multiple formats commonly used in data integration workflows:

**Data Sources Created**

1. **CSV Files** - Structured tabular data
   * `customers.csv` - Customer records (12 entries)
   * `products.csv` - Product catalog (12 entries)
   * `sales.csv` - Sales transactions (15 entries)
2. **JSON Files** - API responses and configuration
   * `api_response.json` - Nested API response with orders
   * `user_events.json` - Event stream (JSONL format)
   * `config.json` - Application configuration
3. **XML Files** - Legacy system exports
   * `inventory.xml` - Warehouse inventory data
   * `employees.xml` - HR employee records
4. **Log Files** - Application and system logs
   * `application.log` - Structured application logs
   * `access.log` - Web server access logs
   * `error.log` - Error and warning logs
5. **Parquet Files** (Optional - requires Python)

   * `transactions.parquet` - Big data format for analytics

**Buckets Created**

* **raw-data** - Landing zone for raw source files
* **staging** - Intermediate processing area
* **curated** - Clean, processed data ready for consumption
* **logs** - Application and process logs
* **archive** - Historical data archives
  {% endhint %}

1. Ensure MinIO API is accessible.

```bash
curl -sf http://localhost:9000/minio/health/live && echo "MinIO is running" || echo "MinIO is not responding"
```

<figure><img src="/files/hNUncqCFkVxDXOVjt1iW" alt=""><figcaption><p>Check MinIO API</p></figcaption></figure>

2. Install the prerequisite packages to generate data and run script:

{% hint style="info" %}

1. **Checks Dependencies** - Verifies MinIO Client (mc) is installed
2. **Tests Connectivity** - Ensures MinIO is running and accessible
3. **Configures Client** - Sets up MinIO Client alias
4. **Creates Buckets** - Creates organizational buckets
5. **Generates CSV Files** - Creates customer, product, and sales data
6. **Generates JSON Files** - Creates API responses and configuration
7. **Generates XML Files** - Creates inventory and employee data
8. **Generates Log Files** - Creates realistic application logs
9. **Uploads to MinIO** - Copies all files to appropriate buckets
   {% endhint %}

{% tabs %}
{% tab title="Linux" %}

1. Check python3 is installed.

```python
python3 -V
```

2. Install python3-venv package.

```bash
sudo apt install python3.12-venv
```

3. Install required packages.

```bash
# Create venv
python3 -m venv ~/venv

# Activate it
source ~/venv/bin/activate

# Install packages
pip install pandas pyarrow

# When done, deactivate
deactivate
```

<figure><img src="/files/llz3YdLxd2noaUvNBaUF" alt=""><figcaption><p>Install packages</p></figcaption></figure>

```bash
# Optional: Install utilities
sudo apt install curl jq
```

4. Install MinIO Client (mc).

```bash
wget https://dl.min.io/client/mc/release/linux-amd64/mc
chmod +x mc
sudo mv mc /usr/local/bin/
```

5. Verified its installed.

```
mc --version
```

6. Execute install script.

```bash
cd
cd /opt/minio

# Run the script
sudo ./populate-minio.sh
```

<figure><img src="/files/kHxpakuzKQS3r1x6vB4v" alt=""><figcaption></figcaption></figure>
{% endtab %}

{% tab title="Windows" %}
x

```powershell
pip install pandas pyarrow
```

{% endtab %}
{% endtabs %}
{% endtab %}

{% tab title="VFS" %}
{% hint style="info" %}
**Virtual File Systems**

PDI allows you to establish connections to most Virtual File Systems (VFS) through VFS connections. These connections store the necessary properties to access specific file systems, eliminating the need to repeatedly enter configuration details.

Once you've added a VFS connection in PDI, you can reference it whenever you need to work with files or folders on that Virtual File System. This streamlines your workflow by allowing you to reuse connection information across multiple steps.

For instance, if you're working with Hitachi Content Platform (HCP), you can create a single VFS connection and then use it throughout all HCP transformation steps. This approach saves time and ensures consistency by removing the need to re-enter credentials or access information for each data operation.
{% endhint %}

1. Start Pentaho Data Integration.

{% hint style="info" %}
**Windows - PowerShell**

```powershell
Set-Location C:\Pentaho\design-tools\data-integration
.\spoon.bat
```

{% endhint %}

{% hint style="info" %}
**Linux**

```bash
cd
cd ~/Pentaho/design-tools/data-integration
./spoon.sh
```

{% endhint %}

***

**Create a VFS connection to the MinIO buckets**

1. Click: 'View' Tab.
2. Right mouse click on VFS Connections > New.

<figure><img src="/files/RyALMEYTdGB07XDhpzJz" alt=""><figcaption><p>VFS connection</p></figcaption></figure>

3. Enter the following details:

<figure><img src="/files/PFw8WU1ahCGOGllv7zVi" alt=""><figcaption><p>VFS MinIO</p></figcaption></figure>

<table><thead><tr><th width="229">Setting</th><th>Value</th></tr></thead><tbody><tr><td>Connection Name</td><td>MinIO</td></tr><tr><td>Connection Type</td><td>Minio/HCP</td></tr><tr><td>Description</td><td>Connection to sales-data bucket</td></tr><tr><td>S3 Connection Type</td><td>Minio/HCP</td></tr><tr><td>Access Key</td><td>minioadmin</td></tr><tr><td>Secret Key</td><td>minioadmin</td></tr><tr><td>Endpoint</td><td>http://localhost:9000 [MinIO API endpoint]</td></tr><tr><td>Signature Version</td><td>AWSS3V4SignerType</td></tr><tr><td>PathStyle Access</td><td>enable</td></tr><tr><td>Root Folder Path</td><td>/</td></tr></tbody></table>

5. Test the connection.
   {% endtab %}
   {% endtabs %}
   {% endtab %}

{% tab title="SMB" %}
{% hint style="info" %}
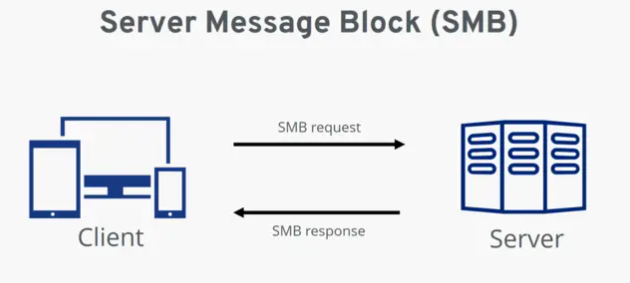
In this hands-on workshop, you'll learn to deploy and configure an SMB (Server Message Block) server using Docker Desktop and on Linux.
{% endhint %}

<figure><img src="/files/USOl0Hsg6X3vGpYH0NEF" alt=""><figcaption><p>SMB</p></figcaption></figure>

{% tabs %}
{% tab title="Linux" %}
{% hint style="info" %}
Follow the instructions outlined below to deploy an SMB server on Ubuntu 24.04.
{% endhint %}

1. Ensure all installed Packages are up-to-date.

```bash
sudo apt update && sudo apt upgrade -y
```

2. Install Samba server.

```bash
sudo apt install tasksel
sudo tasksel install samba-server
```

3. Make a copy of the existing configuration file and create a new `/etc/samba/smb.conf` configuration file

```bash
sudo cp /etc/samba/smb.conf /etc/samba/smb.conf_backup
sudo bash -c 'grep -v -E "^#|^;" /etc/samba/smb.conf_backup | grep . > /etc/samba/smb.conf'
```

4. Any user existing on the samba user list must also exist within the `/etc/passwd` file.

```bash
sudo smbpasswd -a pentaho
```

```
New SMB password: password
Retype new SMB password: password
Added user pentaho.
```

5. Add the home directory share.

```bash
sudo nano /etc/samba/smb.conf
```

6. Copy & paste the following to the bottom of the file - private home & public access.

```
[homes]
   comment = Home Directories
   browseable = yes
   read only = no
   create mask = 0700
   directory mask = 0700
   valid users = %S
[public]
  comment = public anonymous access
  path = /var/samba/
  browsable =yes
  create mask = 0660
  directory mask = 0771
  writable = yes
  guest ok = yes
```

7. Save.

```
CTRL + O
Enter
CTRL + X
```

8. Create a directory that mounts public share and change its access permission.

```bash
sudo mkdir /var/samba
sudo chmod 777 /var/samba/
```

9. Restart your samba server.

```bash
sudo systemctl restart smbd
```

***

{% hint style="info" %}
**SMB Server**

We're going to setup the Samba server with access to shareable, public directory - /var/samba/ - that can be accessed anonymously.

Next .. access to the 'pentaho user' - /pentaho/home directory. Obviously you'll need to be a registered user with a password to access the directory.
{% endhint %}

1. Let’s create some test files.

```bash
touch /var/samba/public-share 
touch /home/pentaho/home-share
```

{% tabs %}
{% tab title="Public" %}
{% hint style="info" %}
**Public**

A 'public' directory that be accessed from any machine ..
{% endhint %}

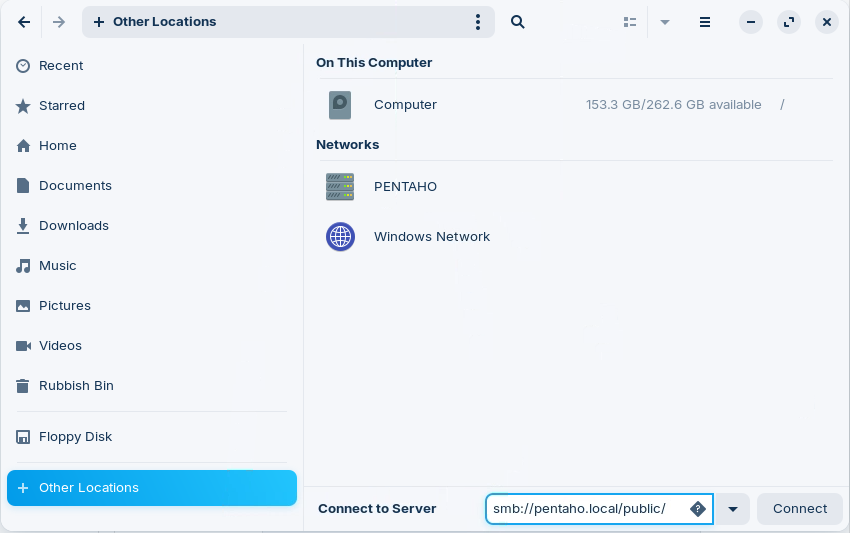
1. In File Explorer, select: + Other Locations.
2. Enter the following connection details:

<figure><img src="/files/ZL5zmtX3XHnmYIPAufu0" alt=""><figcaption><p>Connect to public share</p></figcaption></figure>

```
smb://pentaho.local/public/
```

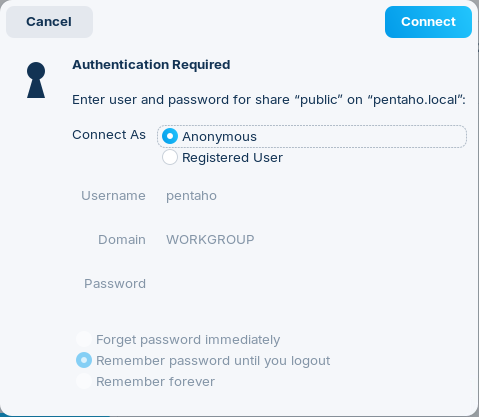
3. Connect as: Anonymous.

<figure><img src="/files/XCwDUaXEj5abR0Y9tIrF" alt="" width="359"><figcaption><p>Connect as: Anonymous</p></figcaption></figure>

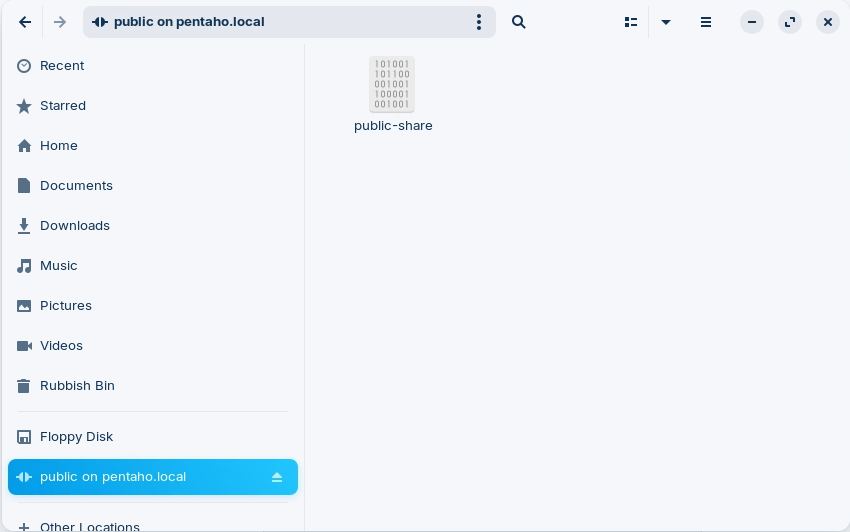
4. You should see the public-share file.

<figure><img src="/files/quERGvgmmt8SFCXXSZFw" alt=""><figcaption><p>public-share</p></figcaption></figure>
{% endtab %}

{% tab title="Registered" %}
{% hint style="info" %}
**Registered**

Only registered users can access the /pentaho/home directory ..
{% endhint %}

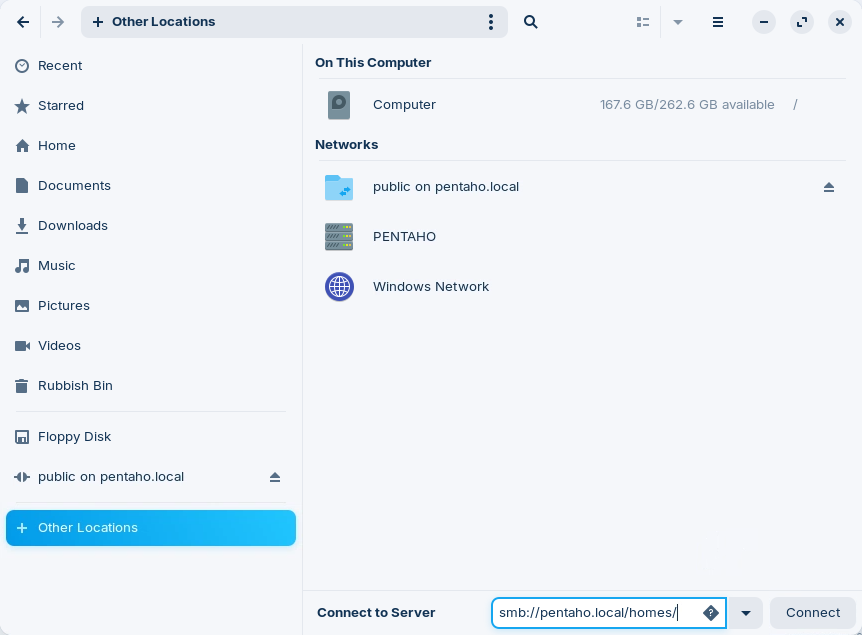
1. In File Explorer, select: + Other Locations.
2. Enter the following connection details:

<figure><img src="/files/n3VdCoLTGdREL0A4N7f0" alt=""><figcaption><p>Connect to /pentaho/home</p></figcaption></figure>

```
smb://pentaho.local/homes/
```

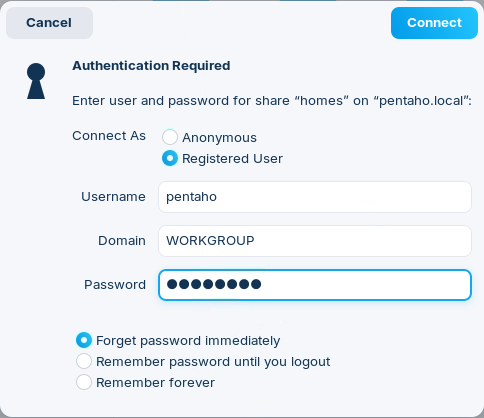
3. Connect as: Registered User.

Username: pentaho

Domain: WORKGROUP

Password: password

<figure><img src="/files/a8AfcAKDa1Ay9RWlcM4E" alt=""><figcaption><p>Connect as 'Registered' user</p></figcaption></figure>

4. You should see the public-share file somewhere in the /home directory.
5. Follow the instructions below to deploy:
   {% endtab %}
   {% endtabs %}
   {% endtab %}

{% tab title="Windows" %}
{% hint style="info" %}
Follow the instructions below to deploy an SMB Docker container. We're going to deploy a very simple SMB server with 2 users:

Alice -

Bob -

As Windows already has a default SMB server running on port:445 so this is changed to 1445.
{% endhint %}

**Pentaho Data Integration**

1. (Optional) Download the latest jcifs driver.

{% embed url="<https://central.sonatype.com/artifact/org.codelibs/jcifs/2.1.40/versions>" %}
Link to Maven jcifs
{% endembed %}

2. (Optional) Copy the JCIFS JAR file into Pentaho Data Integration "lib" folder.

{% hint style="danger" %}
**Download CIFS driver**

Pentaho Data Integration ships with jcifs-1.3.3.jar

If you wish to replace the current driver, rename to: jcifs-1.3.3.jar -> jcifs-1.3.3.jar.bak

jcifs 2.1.40.jar driver has been downloaded to the Workshop--Data-Integration/Drivers
{% endhint %}

***

**Create SMB Share Directories**

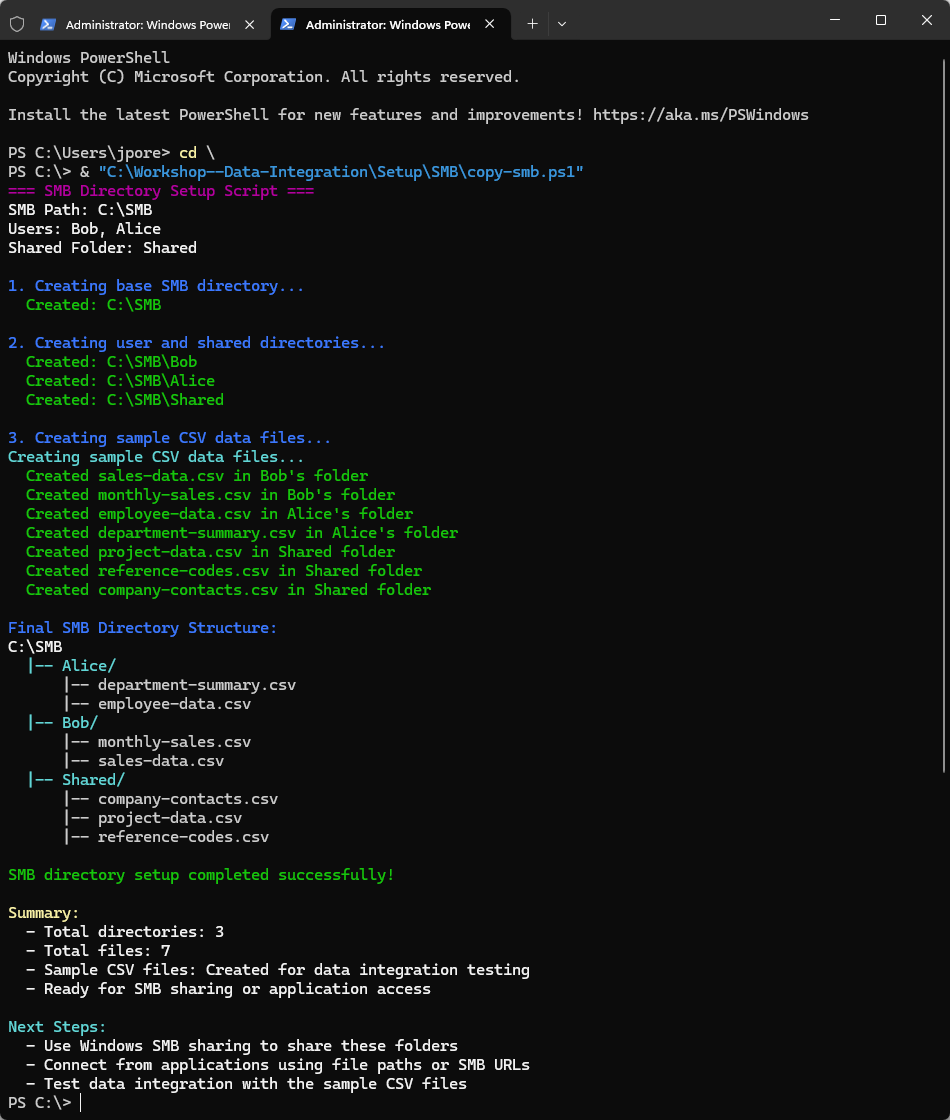
1. Create a SMB folder and copy the required files. Will also add some sample data.

{% hint style="info" %}
**Create directory & copy - PowerShell**

```powershell
cd \
& "C:\Workshop--Data-Integration\Setup\SMB\copy-smb.ps1"
```

{% endhint %}

2. Check the Directory has been created and the files copied over.

<figure><img src="/files/mahZwW3BrVUaXqCJBDgw" alt=""><figcaption><p>Create SMB directories.</p></figcaption></figure>

x

x

{% tabs %}
{% tab title="Users" %}
{% hint style="info" %}
**Creating Local Windows Users**

Let's add our SMB users to the system:

Bob -

Alice -
{% endhint %}

1. Right-click on the Start button.
2. Select Computer Management from the context menu.
3. Alternatively, press `Win + X` and select Computer Management.
4. In Computer Management, expand System Tools.
5. Click on: Local Users and Groups.
6. Select Users folder.
7. Right-click in the Users pane (right side).
8. Select New Use&#x72;**...**
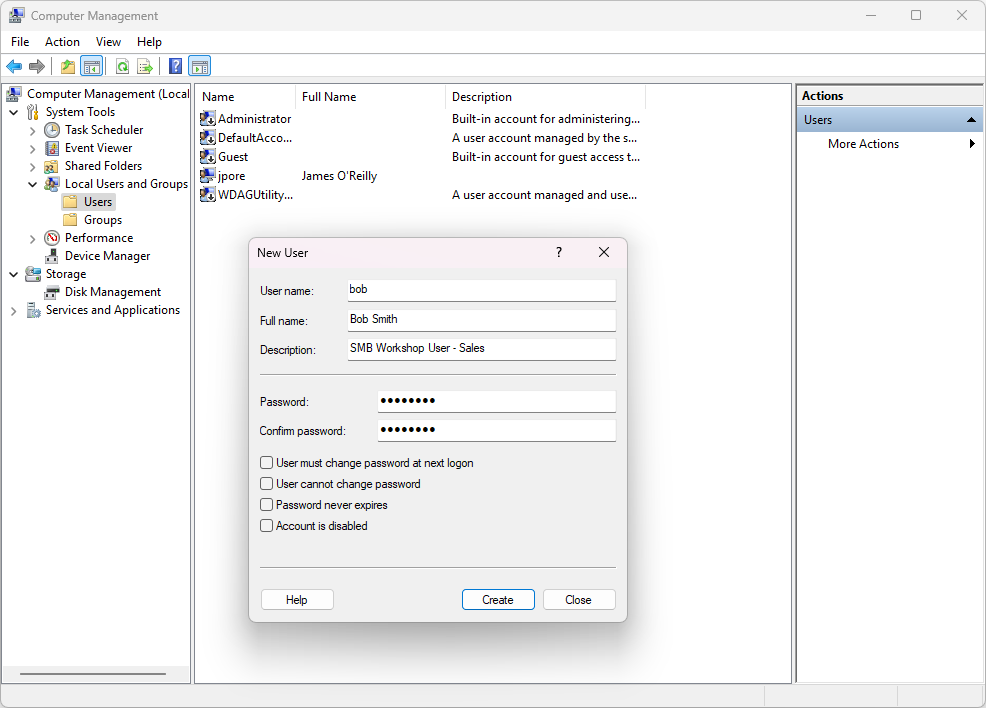
9. Fill in the following details:

Username: bob

Full Name: Bob Smith

Password: password

<figure><img src="/files/ipdnw7U0s8ebDkVjDGqc" alt=""><figcaption><p>Create user - bob.</p></figcaption></figure>

10. Click **Create**
11. Click **Close**
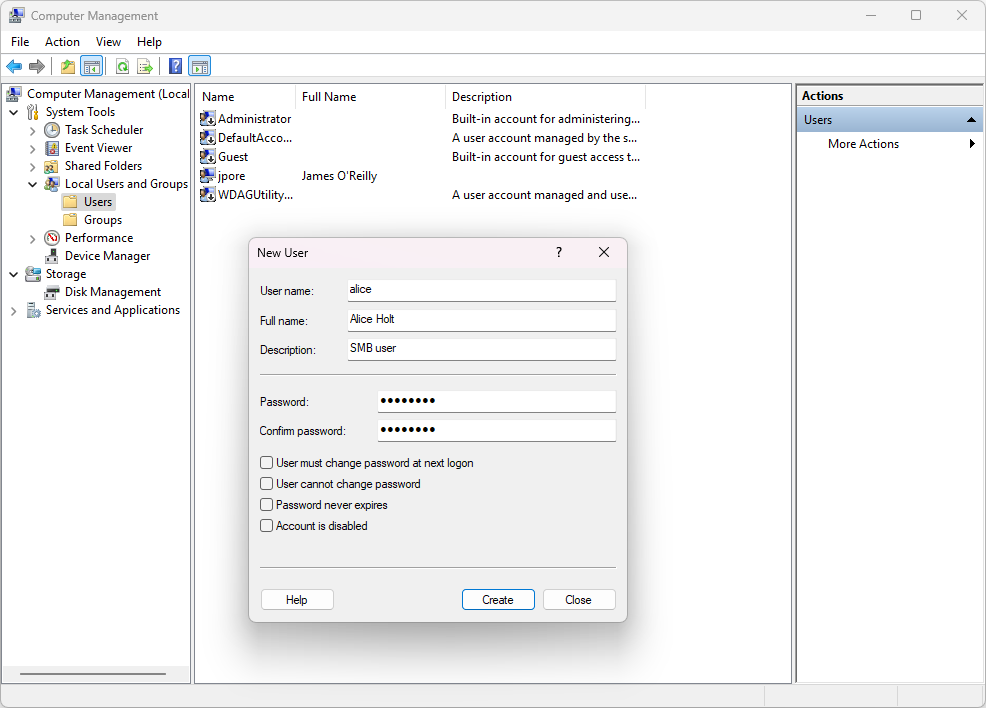
12. Repeat the workflow to create: alice

<figure><img src="/files/vUvELVWen0i9zfMnwNzK" alt=""><figcaption><p>Create user - alice.</p></figcaption></figure>
{% endtab %}

{% tab title="Configuring Folder Permissions" %}
{% hint style="info" %}
**Configure Folder Permissions**
{% endhint %}

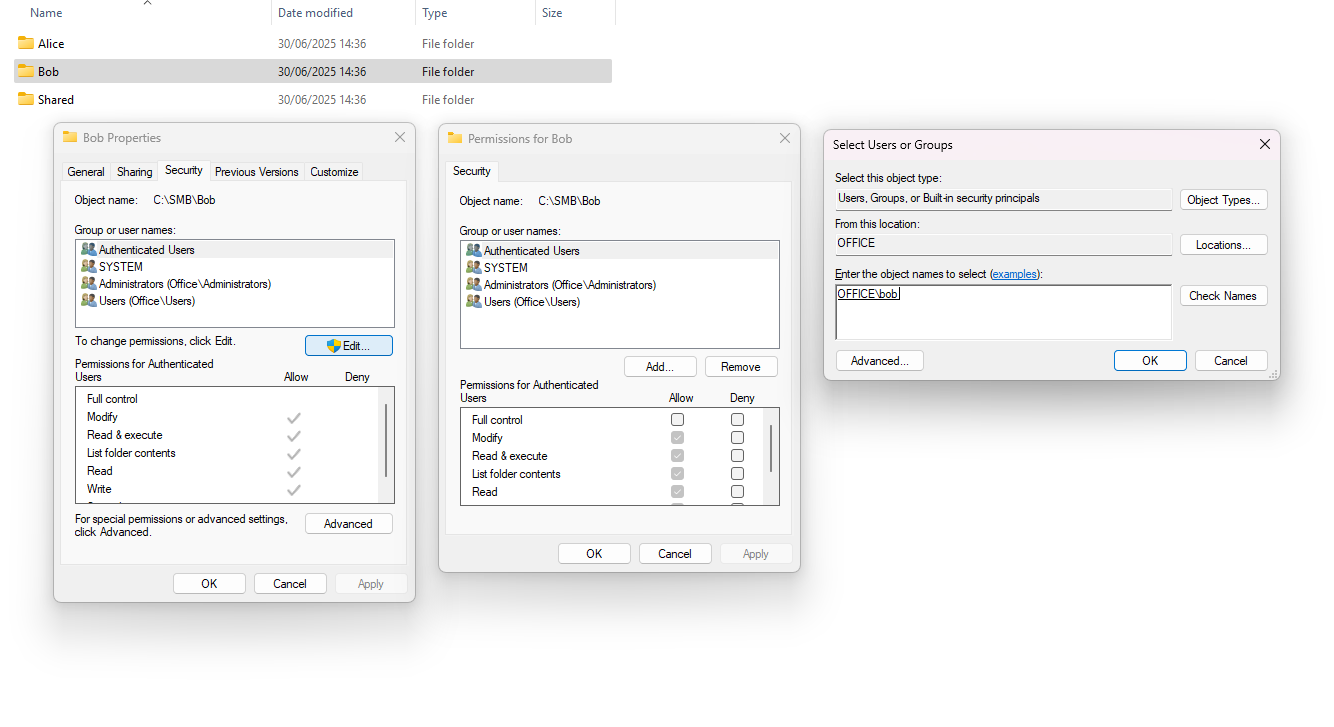
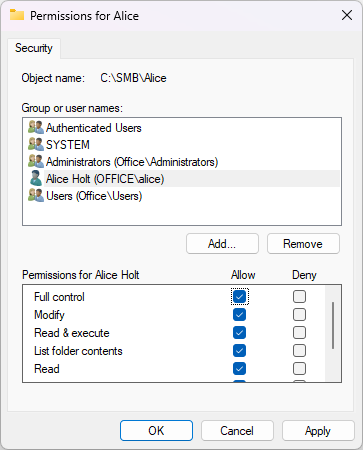
1. Open File Explorer and navigate to `C:\SMB\Bob`
2. Right-click on the Bob folder.
3. Select Properties.
4. Click the Security tab.
5. Click Edit...
6. Click Add...
7. Type `bob` in the text box and click: Check Names
8. Click OK.
9. Select: bob in the permissions list.

<figure><img src="/files/U4hj6BR0tpAs0Ni9umNs" alt=""><figcaption><p>Set bob folder permissions.</p></figcaption></figure>

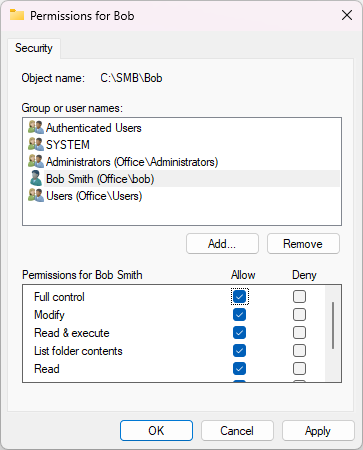
10. Check the following permissions:
11. Click **OK** twice

<figure><img src="/files/BbrukmaA7DLG2WPLev8S" alt=""><figcaption><p>Permissions - bob.</p></figcaption></figure>

12. Repeat the workflow for alice's folder.

<figure><img src="/files/TA956NrVvQtaPvoIOGeX" alt=""><figcaption><p>Permissions - alice.</p></figcaption></figure>
{% endtab %}

{% tab title="SMB Sharing" %}
{% hint style="info" %}
**SMB Share**
{% endhint %}

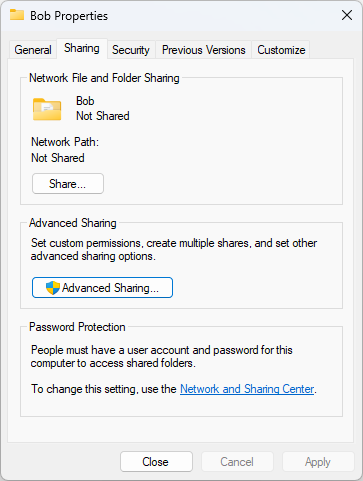
1. Right-click on the `C:\SMB\Bob` folder.
2. Select Properties.
3. Click the Sharing tab.
4. Click Advanced Sharing...

<figure><img src="/files/rbiq9lhl5hJugngf4Nhu" alt=""><figcaption><p>Share - Bob</p></figcaption></figure>

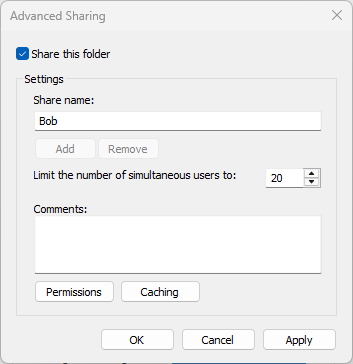
5. ☑ Check "Share this folde&#x72;**"**
6. Share name: Bob (default is fine).

<figure><img src="/files/eGZkB82IjC50PKYDB6u8" alt=""><figcaption><p>Set Share name - Bob</p></figcaption></figure>

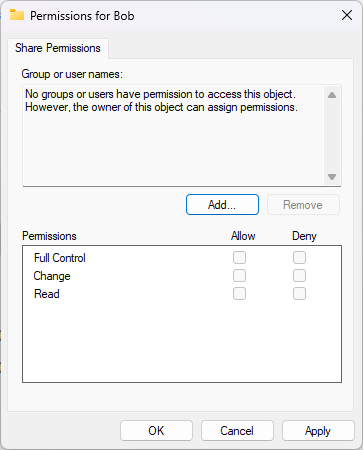
7. Click Permissions.
8. Remove "Everyone" if present (select and click Remove).
9. Click Add...

<figure><img src="/files/9dIkuqAP5I9AUL83dFFp" alt=""><figcaption><p>Remove Everyone &#x26; Add Bob</p></figcaption></figure>

7. Add the following user:
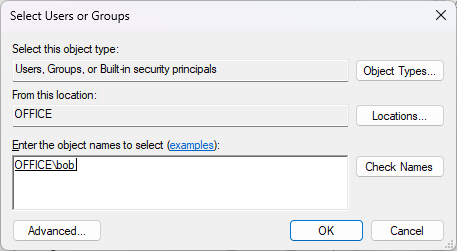
   * Type `bob`, click Check Names, click OK

<figure><img src="/files/kihynfzsyP692yLTw5BO" alt=""><figcaption><p>Check Names - bob</p></figcaption></figure>

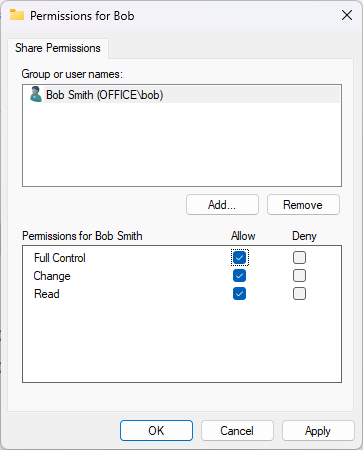
7. Set permissions for Bob Smith:
   * Select Bob Smith: ☑ Full Control

<figure><img src="/files/oE9QX8T5PaswJfsPOtqN" alt=""><figcaption><p>Permissions for Bob Smith</p></figcaption></figure>

7. Click OK three times.

{% hint style="info" %}
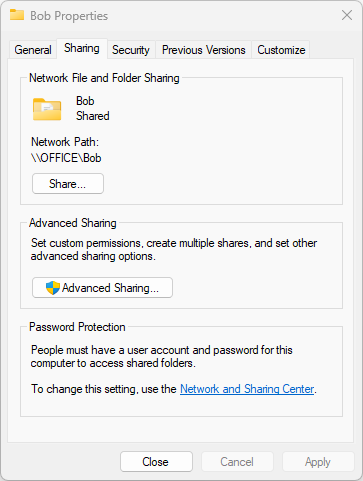
In the Sharing tab, note the Network Path: \\\\\[Computer Name]\Bob

From another computer: `\\[your-computer-ip]\Bob`
{% endhint %}

<figure><img src="/files/a2I5K0O40bBXRh8src2s" alt=""><figcaption><p>Network Path</p></figcaption></figure>

{% hint style="warning" %}
Obviously if you want to play around with the SMB shares for Alice & 'Shared' then you will have to repeat the workflow.
{% endhint %}

***

{% hint style="info" %}
**Test**

Time to test ..

Let's see if we can access C:\SMB\Bob from across the Network.
{% endhint %}

1. In the File Explorer or Run command , enter the following UNC path to access C:\SMB\Bob

```
\\[Computer Name]\Bob or \\localhost\Bob
```

You should see the following popup message displayed:

<figure><img src="/files/qdfSLg6iF3COqUUVP5Om" alt=""><figcaption></figcaption></figure>

x
{% endtab %}
{% endtabs %}
{% endtab %}
{% endtabs %}
{% endtab %}
{% endtabs %}


---

# Agent Instructions: Querying This Documentation

If you need additional information that is not directly available in this page, you can query the documentation dynamically by asking a question.

Perform an HTTP GET request on the current page URL with the `ask` query parameter:

```
GET https://academy.pentaho.com/pentaho-data-integration/setup/data-sources/storage.md?ask=<question>
```

The question should be specific, self-contained, and written in natural language.
The response will contain a direct answer to the question and relevant excerpts and sources from the documentation.

Use this mechanism when the answer is not explicitly present in the current page, you need clarification or additional context, or you want to retrieve related documentation sections.