# Kettle EE plugins

{% hint style="info" %}

#### Pentaho Data Integration Plugin Manager

Pentaho Data Integration (PDI) can be extended with plugins that add new steps, job entries, and other functionality. The best way to manage these plugins is through the Plugin Manager, which you'll find in both the PDI client and Pentaho User Console (PUC).

The Plugin Manager handles all your plugin needs: installing new ones, updating existing ones to their latest versions, and removing plugins you no longer use.

While you can install plugins manually, this approach isn't recommended. Manually installed plugins won't show up in the Plugin Manager, which means you'll have to handle all future updates and removals yourself.
{% endhint %}

x

x

x

{% tabs %}
{% tab title="Hierarchical Data Types" %}
{% hint style="info" %}

#### HDT

A hierarchical data type can be used to store and query data that is organized in a tree-like fashion, such as organizational charts, file systems, or taxonomies.
{% endhint %}

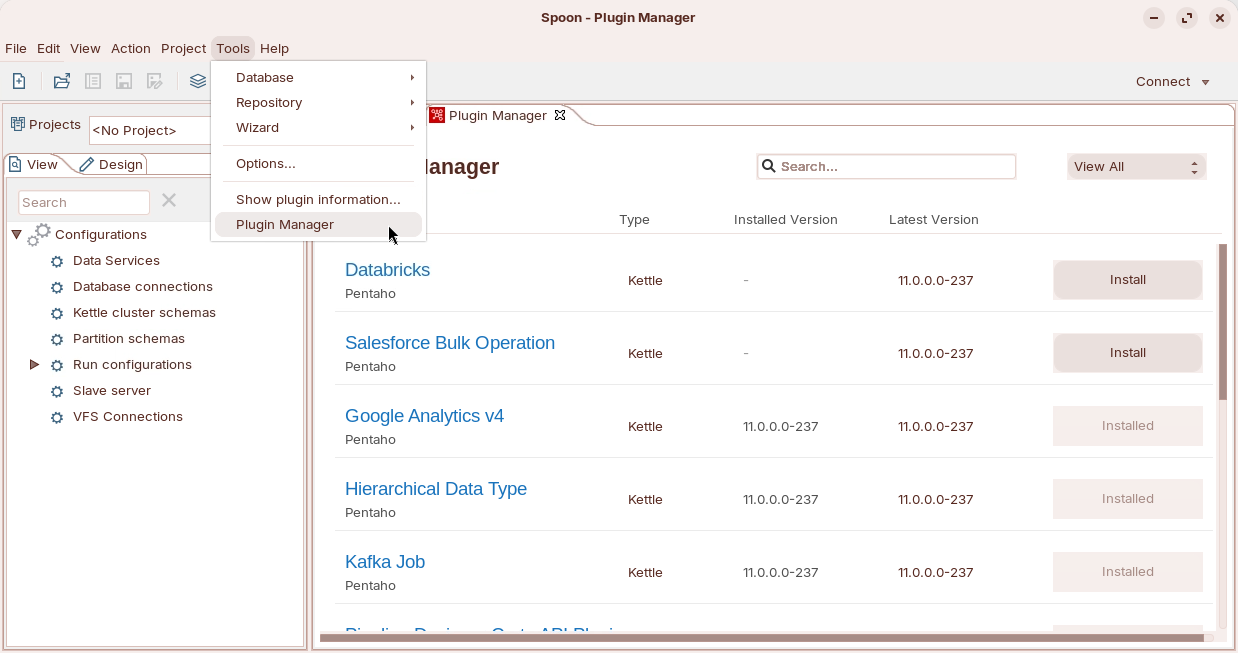
1. In the top toolbar Select: Tools > Plugin Manager.

<figure><img src="/files/ixVbzaZMbLR41vGHEimG" alt=""><figcaption><p>PDI Plugin Manager</p></figcaption></figure>

**Installing a Plugin:** Find the plugin you want to install by searching or browsing the available options.

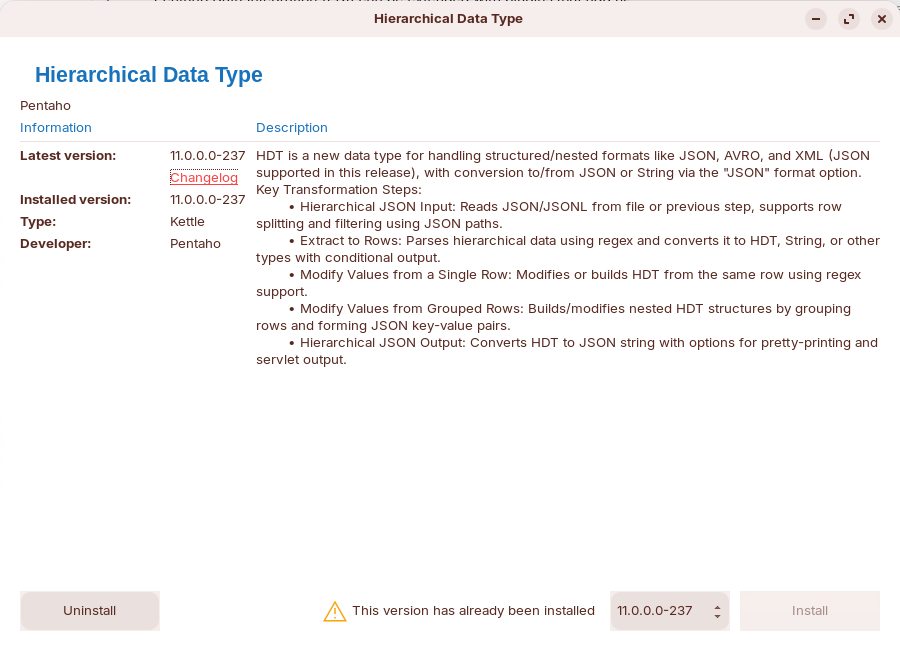
**For the latest version:** Simply click Install.

<figure><img src="/files/tFatc4WOrBH0aDSQRGjs" alt=""><figcaption></figcaption></figure>

**For an earlier version:** Click on the plugin's table row to open the Plugin name dialog box. Select your desired version from the dropdown list and click Install. Confirm the installation if prompted.

**Restart to activate:** After installation, restart both Pentaho Server & PDI client. This step is essential - newly installed plugins won't work until you restart.

**Verify the installation:** Log into the PDI client and navigate to Tools > Plugin Manager. Search for or browse to your newly installed plugin. Check the Installed Version column to confirm the correct version is listed.
{% endtab %}

{% tab title="Kafka" %}
{% hint style="info" %}

#### Kafka

Reconfiguring multiple Docker Compose files for different scenarios can become very tedious. To solve this, you can use a Python script that generates the docker-compose file: Kafka-Docker-Composer.
{% endhint %}

x

{% tabs %}
{% tab title="1. Prerequisites" %}
{% hint style="info" %}

#### Prerequistes

{% endhint %}

1. Check Jinja 2 is installed.

```python
python3 -c "import jinja2"
```

2. If you see a `ModuleNotFoundError`, install jinja2.

```python
sudo apt install python3-jinja2
```

3. Check docker & docker compose is installed.

```docker
docker version
docker compose version
```

{% endtab %}

{% tab title="2. Deploy Kafka Cluster" %}
**Deploy Kafka**

{% hint style="info" %}
The application kafka\_docker\_composer.py takes a list of arguments and determines how the template should be populated. It creates the dependencies between the different components, ensures that names and ports are unique, sets up advertised listeners correctly, and ensures that dependent services like Schema Registry of Kafka Connect point to the corresponding Confluent Server brokers.
{% endhint %}

**Simple Cluster**

{% hint style="info" %}
ZooKeeper is deprecated; therefore, modern versions of Kafka prefer KRaft.

1 Broker&#x20;

1 KRaft Controller
{% endhint %}

1. Generate the docker compose yaml.

```bash
cd
cd ~/Workshop--Data-Integration/Labs/Module\ 7\ -\ Use\ Cases/Streaming\ Data/Kafka
python3 kafka_docker_composer.py --brokers 1 --controllers 1
```

```
Generated docker-compose.yml
```

2. Run the docker compose.

```bash
cd
cd ~/Workshop--Data-Integration/Labs/Module\ 7\ -\ Use\ Cases/Streaming\ Data/Kafka
docker compose up -d
```

3. Check the containers.

```docker
 docker compose ps --format "table {{.Name}}\t{{.Status}}\t{{.Ports}}"
```

4. To bring down the containers & remove volumes.

```bash
cd
cd ~/Workshop--Data-Integration/Labs/Module\ 7\ -\ Use\ Cases/Streaming\ Data/Kafka
docker compose down -v
```

***

**Realistic Cluster**

{% hint style="info" %}
3 Brokers

3 KRaft Controllers

Prometheus - port:9090

Grafana - port:3000  admin/adminpass

Schema Registry

Connector instance - 2

Confluent Control Center - version 7.9.5
{% endhint %}

1. Generate the docker compose yaml.

```bash
cd
cd ~/Workshop--Data-Integration/Labs/Module\ 7\ -\ Use\ Cases/Streaming\ Data/Kafka
python3 kafka_docker_composer.py -b 3 -c 3 -p -s 1 -C 2 --control-center
```

```
Generated docker-compose.yml
```

2. Run the docker compose.

```bash
cd
cd ~/Workshop--Data-Integration/Labs/Module\ 7\ -\ Use\ Cases/Streaming\ Data/Kafka
docker compose up -d
```

3. Check the containers.

```docker
 docker compose ps --format "table {{.Name}}\t{{.Status}}\t{{.Ports}}"
```

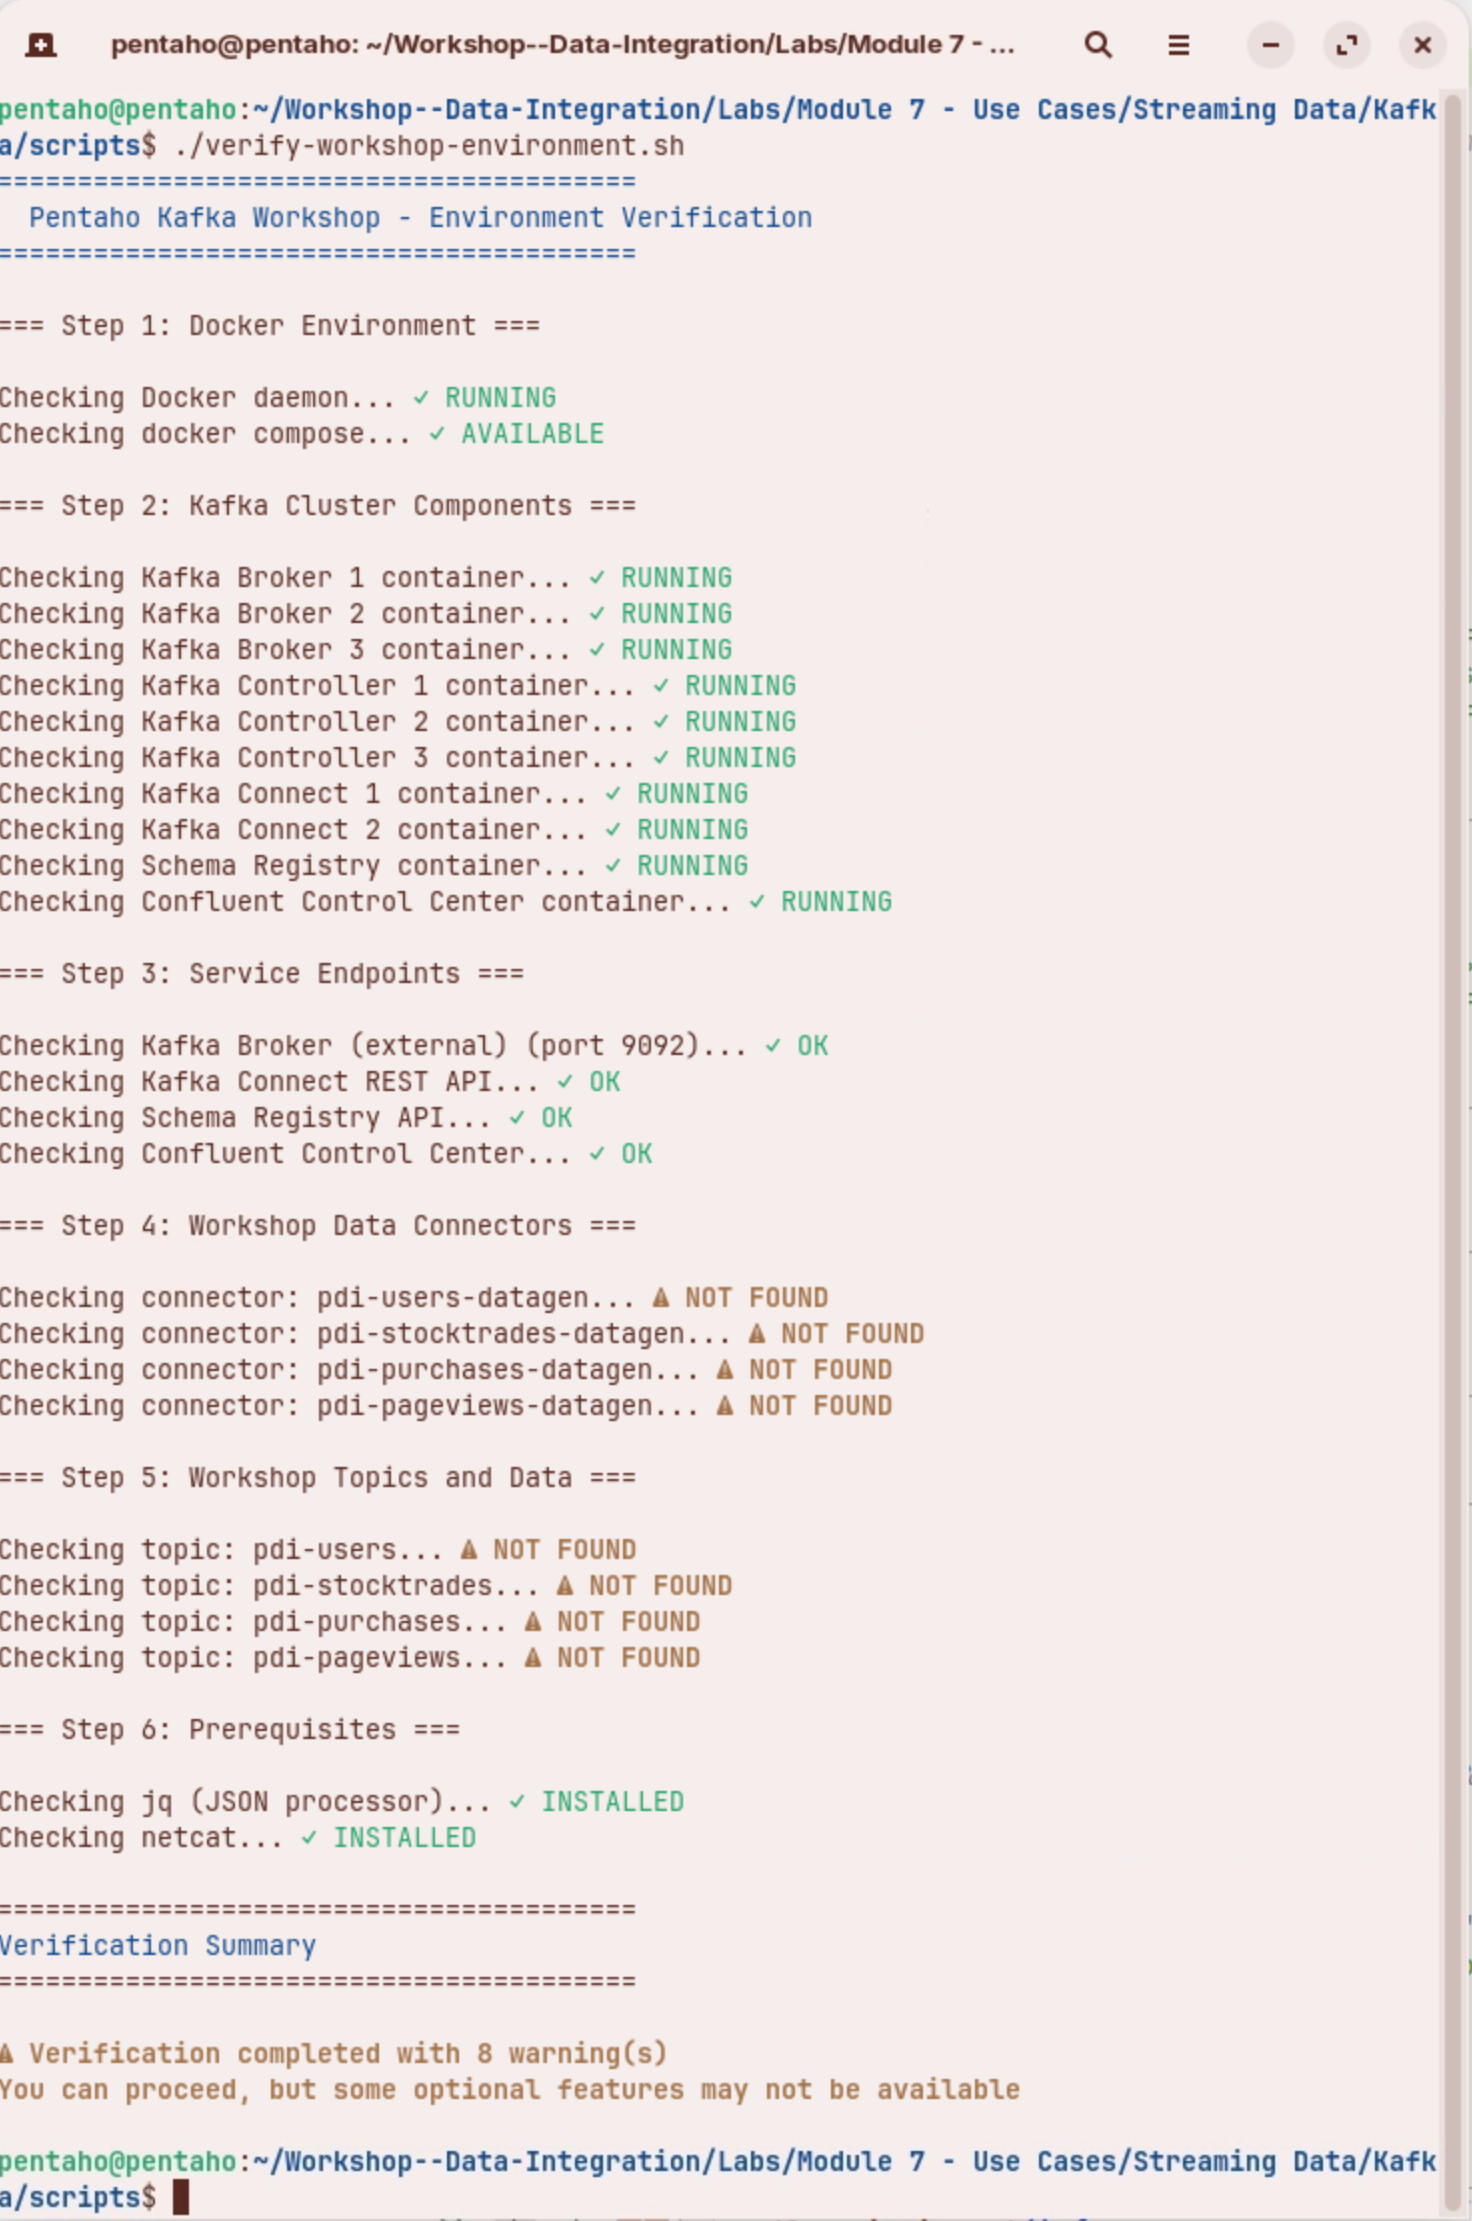
4. Verify the deployment.

```bash
cd
cd ~/Workshop--Data-Integration/Labs/Module\ 7\ -\ Use\ Cases/Streaming\ Data/Kafka/scripts
./verify-workshop-environement.sh
```

<figure><img src="/files/gEzboRSCO3kTCnUpDGkU" alt=""><figcaption><p>Verify environment</p></figcaption></figure>

4. To bring down the containers & remove volumes.

```bash
cd
cd ~/Workshop--Data-Integration/Labs/Module\ 7\ -\ Use\ Cases/Streaming\ Data/Kafka
docker compose down -v
```

***

**Quick Commands**

```bash
# Workshop Management
make workshop-start    # Complete setup (Kafka + Connectors)
make workshop-stop     # Stop everything
make workshop-restart  # Restart everything
make verify            # Verify environment health
make monitor           # Show monitoring dashboard
```

```bash
# Kafka Cluster
make start             # Start Kafka cluster
make stop              # Stop Kafka cluster
make restart           # Restart Kafka cluster
make status            # Show container status
make logs              # View logs
```

```bash
# Data & Connectore
make deploy-connectors   # Deploy workshop data generators
make topics              # List all topics
make consumers           # List consumer groups
make consume-users       # View sample user messages
make consume-trades      # View sample trade messages
```

<pre class="language-bash"><code class="lang-bash"><strong># MySQL Database
</strong>make mysql-setup         # Create database and tables
make mysql-shell         # Connect to MySQL
make mysql-verify        # Verify tables and data
</code></pre>

```bash
# Utilities
make test-connection     # Test all connections
make connectors-status   # Check connector health
make clean               # Remove everything
make help                # Show all commands
```

**Control Center**

{% embed url="<http://localhost:9021>" %}

**Grafana**

{% embed url="<http://localhost:9021>" %}

{% hint style="info" %}
The user and password are set to “admin/adminpass”, you can change in volumes/config.ini.&#x20;
{% endhint %}

**Prometheus**

{% embed url="<http://localhost:9090>" %}

{% hint style="info" %}
There are separate dashboards for ZooKeeper and KRaft controllers as indicated by their names.

The exporter configuration files, dashboards, and the exporter jar are in the volumes directory, so you do not have to download anything separately.&#x20;

It takes a few minutes for JMX exporters to start up. Check the Status/Targets page in Prometheus to see if your metrics scrapes succeeded.
{% endhint %}

**Schema Registry API**

{% embed url="<http://localhost:8081>" %}

x

x
{% endtab %}

{% tab title="3. Connectors" %}
{% hint style="info" %}

#### Datagen Connector

The Confluent Datagen Source Connector (kafka-connect-datagen) is a Kafka Connect plugin designed to generate mock data for development and testing purposes. It is important to note upfront that this connector is not intended for production use - it exists purely to help developers and testers simulate real data flowing through a Kafka pipeline.

The connector uses Avro Random Generator under the hood to define the "rules" for the mock data it produces. You specify an Avro schema via a quickstart template or a custom schema file, and the connector continuously produces records to a Kafka topic based on that schema. Confluent ships several pre-built quickstart schemas out of the box, including pageviews, users, orders, and stock trades, making it easy to get started without writing your own schema right away.

It supports multiple output formats including Avro, JSON Schema, Protobuf, and schemaless JSON, giving you flexibility depending on whether you're working with Confluent Schema Registry or not.

Once running, the connector continuously streams generated records into a Kafka topic, which you can then consume with any Kafka client - such as a standard Kafka consumer, a Kafka Streams application, or ksqlDB - making it a great tool for building out and validating your downstream Kafka pipelines before real data is available.
{% endhint %}

{% embed url="<https://docs.confluent.io/kafka-connectors/datagen/current/overview.html>" %}

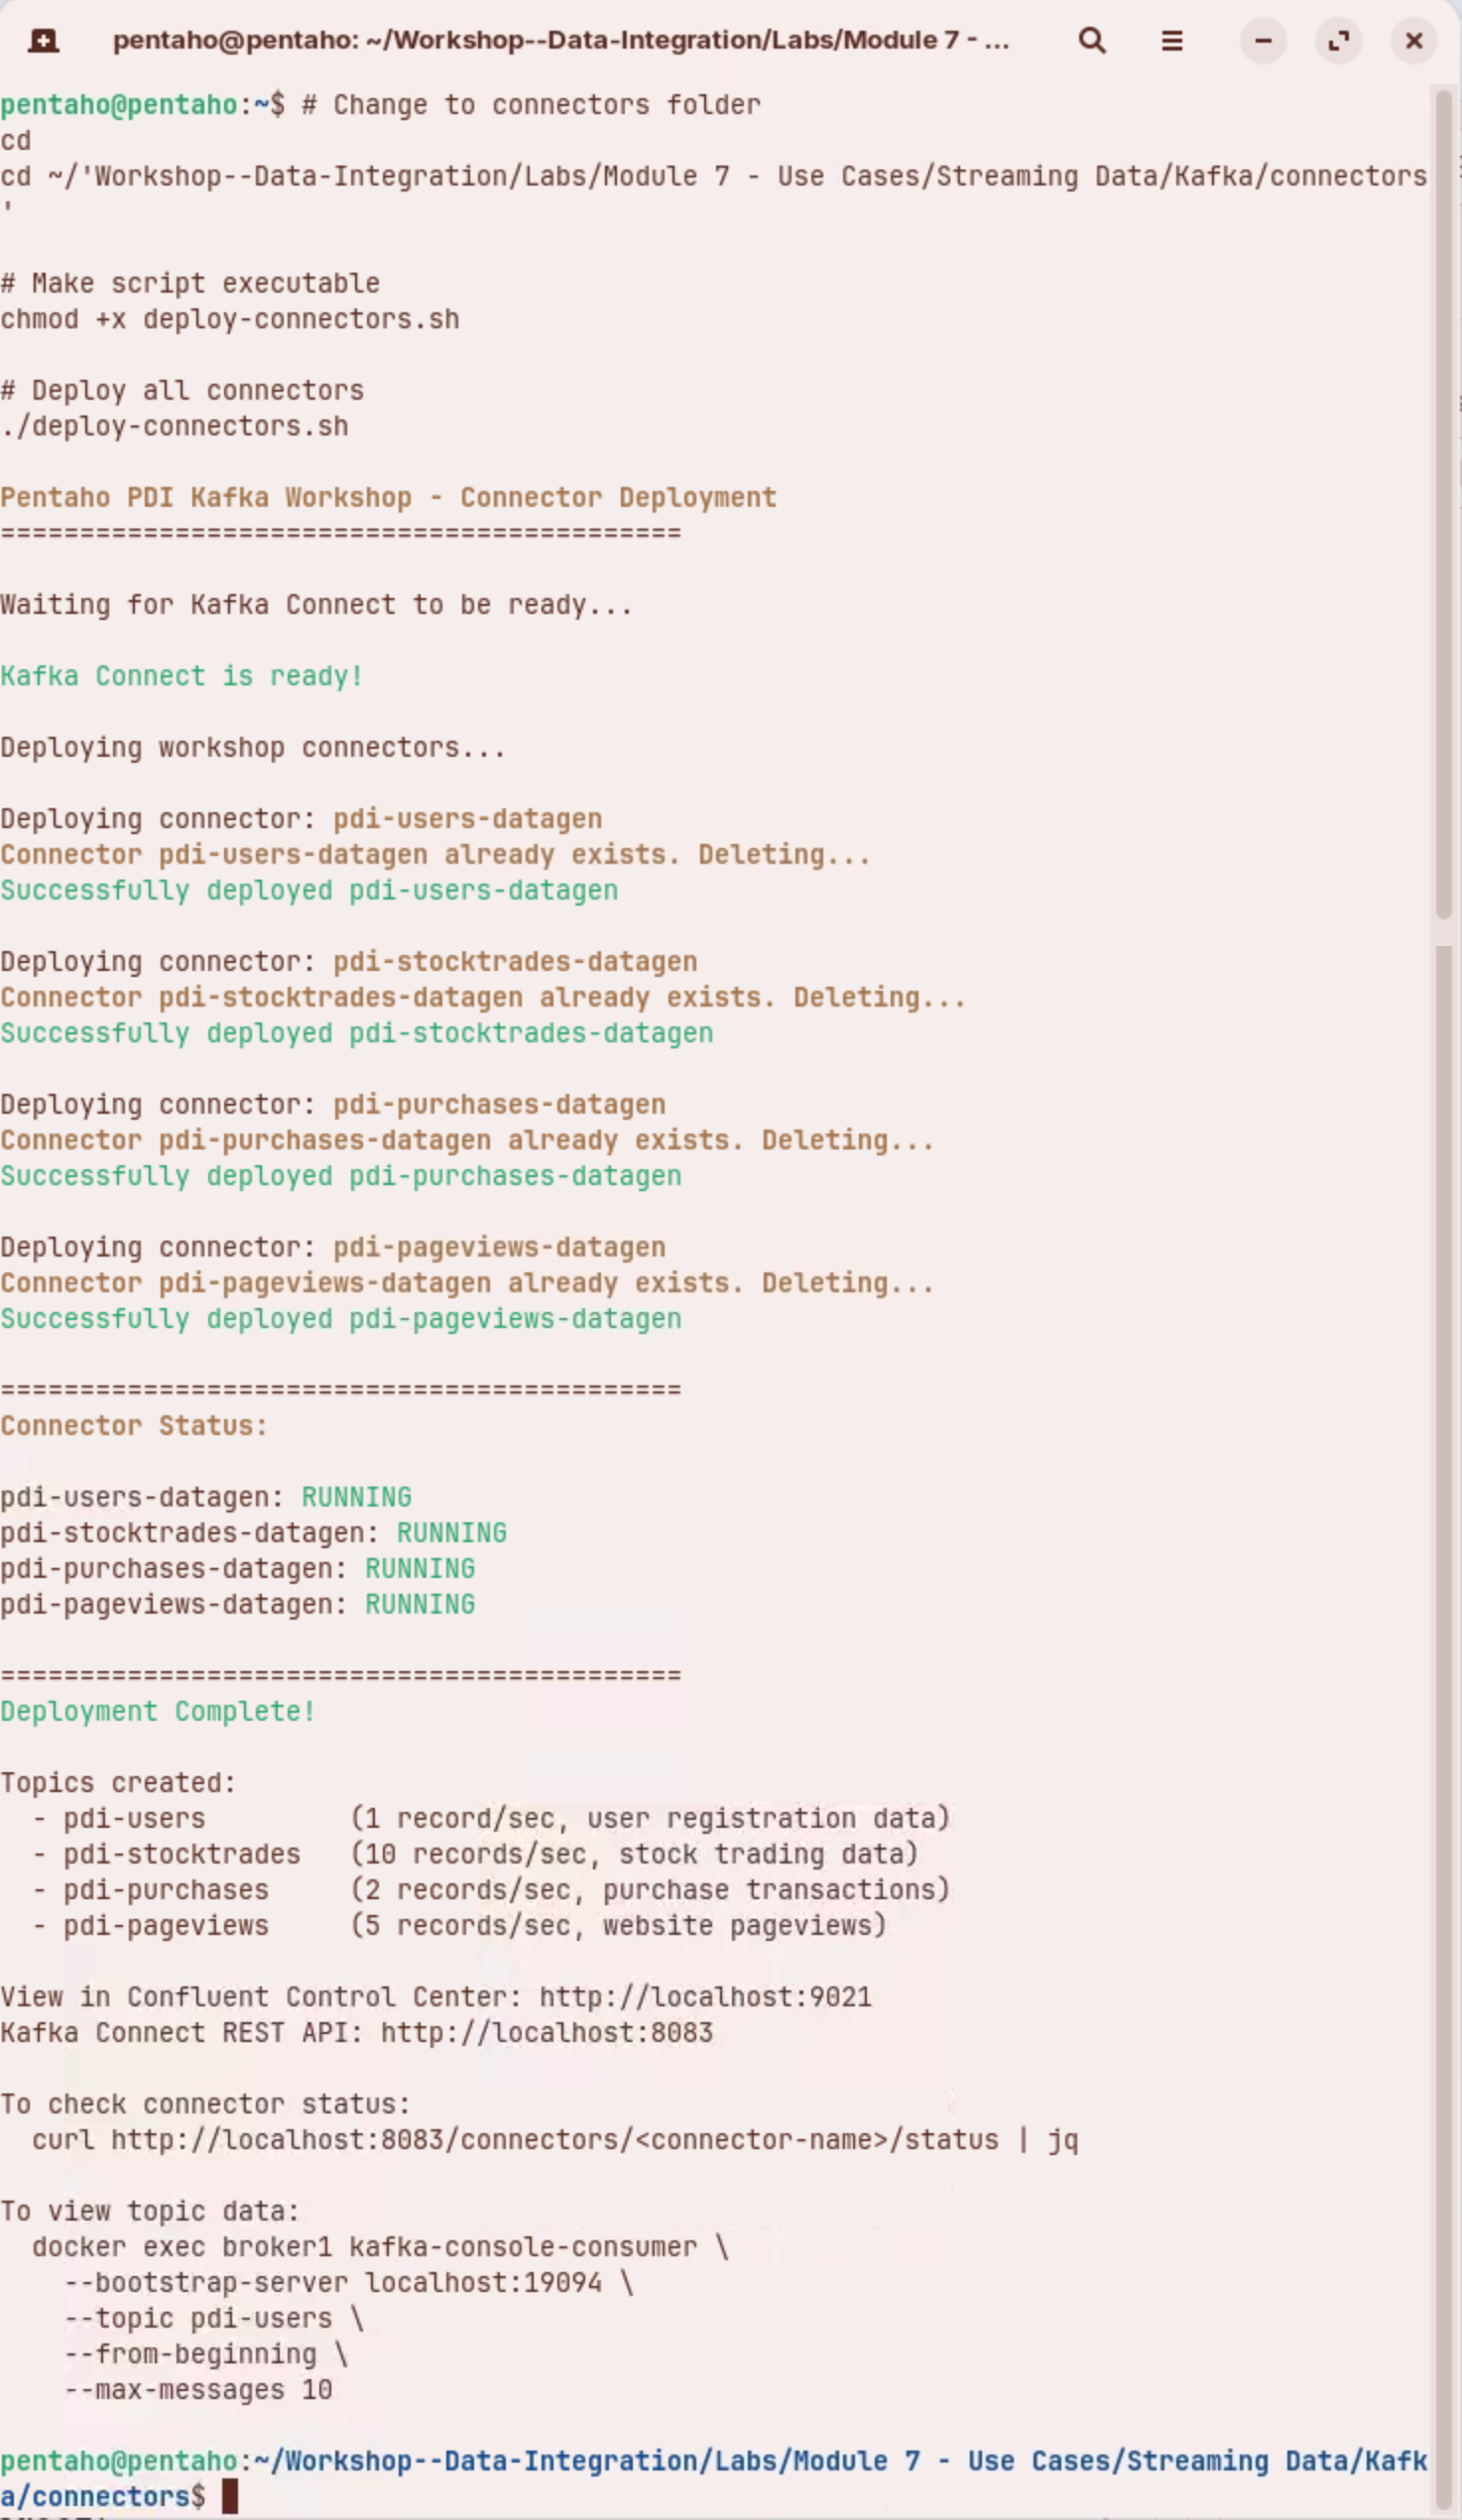
1. Deploy the datagen connectors.

```bash
# Change to connectors folder
cd
cd ~/'Workshop--Data-Integration/Labs/Module 7 - Use Cases/Streaming Data/Kafka/connectors'

# Make script executable
chmod +x deploy-connectors.sh

# Deploy all connectors
./deploy-connectors.sh


```

<figure><img src="/files/A4JJYOachQb6EgLEEf54" alt=""><figcaption><p>Deploy Daragen connectors</p></figcaption></figure>

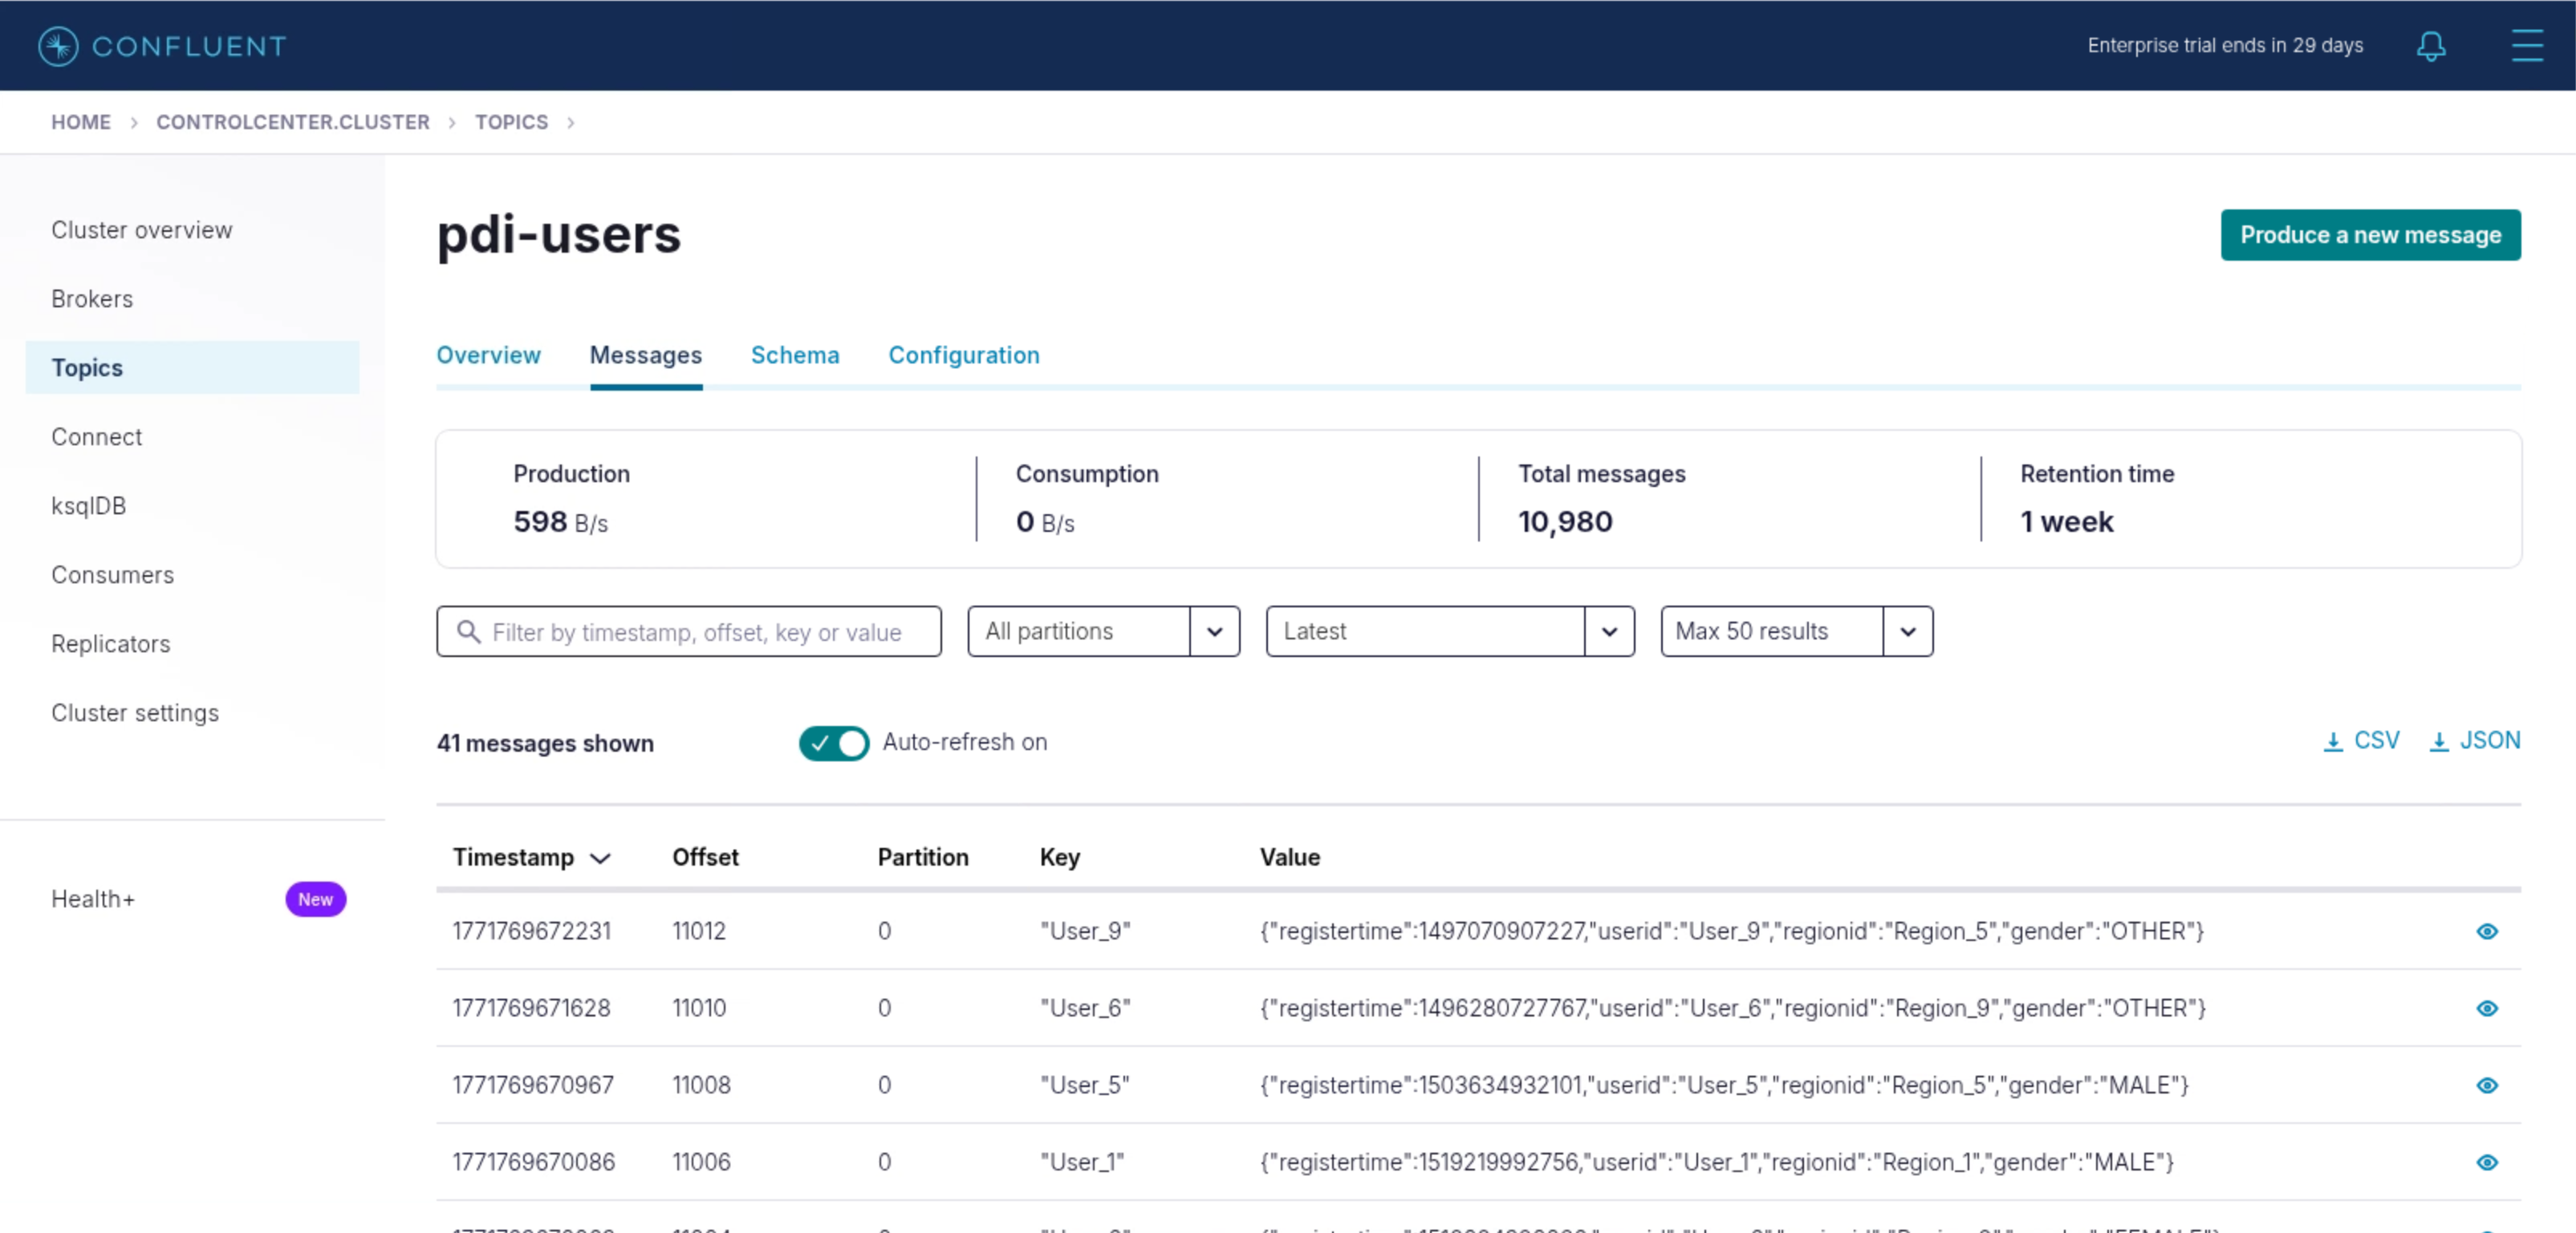
2. Verify data is flowing to the Kafka Clsuter - 5 messages.

```bash
# Verify data is flowing
docker exec kafka-1 kafka-console-consumer \
  --bootstrap-server localhost:9092 \
  --topic pdi-users \
  --from-beginning \
  --max-messages 5
```

3. Log into the Control Center.

{% embed url="<http://localhsot:9021>" %}

<figure><img src="/files/kbERak9Rx0DA7dL6Sk48" alt=""><figcaption><p>Check Topics</p></figcaption></figure>

<figure><img src="/files/9ddTPAfcyARxuDPFs5rT" alt=""><figcaption><p>Check messages</p></figcaption></figure>

{% hint style="info" %}
So you now have data streaming to various topics at different rates via the Datagen connector.
{% endhint %}

<figure><img src="/files/JDutmlJPlATMR9f1BCXN" alt=""><figcaption><p>Control Center dashboard</p></figcaption></figure>
{% endtab %}

{% tab title="4. MySQL " %}
{% hint style="info" %}

#### MySQL

{% endhint %}

1. Deploy the MySQL database using make - uses `docker-compose-mysql.yml`

```bash
cd
cd ~/Workshop--Data-Integration/Labs/Module\ 7\ -\ Use\ Cases/Streaming\ Data/Kafka

# Start MySQL in Docker
make mysql-start
```

<figure><img src="/files/eEwLolUsCDrx4FsC3I3U" alt=""><figcaption><p>MySQL Container</p></figcaption></figure>

{% hint style="info" %}
**What happens:**

* MySQL 8.0 container starts
* Database `kafka_warehouse` created automatically
* User `kafka_user` created with password `kafka_password`
* All tables, views, and stored procedures created automatically
* Data persisted in Docker volume
  {% endhint %}

2. Verify deployment.

```bash
# Check MySQL is running and tables are created
make mysql-verify
```

<figure><img src="/files/G84STQ8YIYFLKneVGmzH" alt=""><figcaption></figcaption></figure>

3. Connect to MySQL.

```bash
# Connect as kafka_user
make mysql-shell

# Or connect as root
make mysql-shell-root
```

{% endtab %}
{% endtabs %}
{% endtab %}

{% tab title="Plugin Matrix" %}

<table><thead><tr><th width="225">Plugin</th><th>Description</th></tr></thead><tbody><tr><td>Databricks</td><td>The Bulk load into Databricks entry loads large volumes of data from cloud storage files directly into Databricks tables. <strong>How it works:</strong> It accomplishes this by using Databricks' <a href="https://docs.databricks.com/aws/en/sql/language-manual/delta-copy-into">COPY INTO</a> command behind the scenes.</td></tr><tr><td>Salesforce Bulk Operation</td><td><p>The Salesforce bulk operation step performs large-scale data operations (insert, update, upsert, and delete) on Salesforce objects using the Salesforce Bulk API 2.0.</p><p><strong>How it works:</strong> The step reads data from an input stream, creates a CSV file of the changes, and executes the bulk job against Salesforce. After the job completes, you can optionally route three types of results to separate output streams: successful records, unprocessed records, and failed records.</p><p><strong>Requirements:</strong> You must have a Salesforce Client ID and Client Secret to use this step.</p></td></tr><tr><td>Google Analytics v4</td><td><p>The Google Analytics v4 step retrieves data from your Google Analytics account for reporting or data warehousing purposes.</p><p><strong>How it works:</strong> The step queries Google Analytics properties through the <a href="https://developers.google.com/analytics/devguides/reporting/data/v1">Google Analytics API v4</a> and sends the resulting dimension and metric values to the output stream.</p></td></tr><tr><td><a href="https://academy.pentaho.com/pentaho-data-integration/data-integration/ee-plugins/hierarchical-data-type">Hierarchical Data Type</a></td><td><p>Pentaho supports a hierarchical data type (HDT) through the Pentaho EE Marketplace plugin. This plugin adds the HDT data type and includes five specialized steps for working with it.</p><p><strong>What it does:</strong> These steps simplify working with complex, nested data structures. They can convert between HDT fields and formatted strings, and let you directly access or modify nested array indices and keys.</p><p><strong>Performance benefits:</strong> The steps significantly improve performance compared to handling hierarchical data as plain strings.</p><p><strong>Data structure:</strong> HDT can store nested or complex data built from objects and arrays, as well as single elements. It's compatible with any PDI step that processes hierarchical data.</p></td></tr><tr><td>Kafka Job</td><td></td></tr><tr><td></td><td></td></tr></tbody></table>
{% endtab %}
{% endtabs %}


---

# Agent Instructions: Querying This Documentation

If you need additional information that is not directly available in this page, you can query the documentation dynamically by asking a question.

Perform an HTTP GET request on the current page URL with the `ask` query parameter:

```
GET https://academy.pentaho.com/pentaho-data-integration/setup/kettle-ee-plugins.md?ask=<question>
```

The question should be specific, self-contained, and written in natural language.
The response will contain a direct answer to the question and relevant excerpts and sources from the documentation.

Use this mechanism when the answer is not explicitly present in the current page, you need clarification or additional context, or you want to retrieve related documentation sections.