Carrier Dashboard
Wireless Carrier dashboard ..
Workshop - Carrier Dashboard
Enterprise dashboards demand sophisticated analytical capabilities that seamlessly integrate multidimensional data analysis with intuitive user interfaces, enabling business users to explore complex telecommunications metrics through interactive visualizations and dynamic filtering. In this comprehensive workshop, you'll build a complete Wireless Carrier analytics dashboard from the ground up, mastering advanced CTools techniques including Mondrian OLAP schema integration, complex MDX query development with calculated members and parameter substitution, hierarchical layout design with CSS styling, and the creation of interactive components that respond to user selections.
Working with a real-world telecommunications dataset, you'll learn how to transform raw call traffic data into a polished, production-ready dashboard that tracks regional calling patterns, platform usage metrics, and month-over-month performance trends across multiple analytical dimensions.
In this hands-on workshop, you'll experience the complete enterprise dashboard development lifecycle, beginning with database setup and Mondrian schema configuration in Schema Workbench, progressing through sophisticated multi-level layout construction with CSS-based styling, and culminating in the creation of parameterized MDX queries that power dynamic selectors, KPI displays, visualizations, and detailed analytical tables.
You'll learn how to work with the baseline_demo PostgreSQL database containing fact tables and dimension tables structured in a star schema optimized for OLAP analysis. As you work through the exercises, you'll master critical techniques including crafting MDX queries with WITH clauses that define calculated members for month-over-month comparisons, implementing parameter substitution using ${parameterName} syntax for dynamic filtering, configuring output column ordering and renaming for presentation clarity, and handling null values with IIf(IsEmpty()) logic to prevent calculation errors. You'll also develop expertise in creating responsive dashboard layouts with nested rows and columns, applying external CSS stylesheets for consistent visual design, and structuring CDA data sources that support interactive component behavior through parameter-driven queries.
What You'll Accomplish:
Database and OLAP Schema Infrastructure - Groups PostgreSQL connection, JDBC setup, Schema Workbench, Mondrian schema import, and cube navigation
Multi-Level Dashboard Layouts - Combines all layout design elements (rows, columns, headers, KPIs, charts, tables)
CSS Styling - Consolidates external CSS resources, application, and visual consistency validation
MDX Data Source Connections - Groups connection creation, JNDI/schema configuration, and parameter-driven structure
Advanced MDX Queries - Consolidates WITH clauses, calculated members, temporal functions, null handling, hierarchies, and CROSSJOIN
Dynamic Parameterization - Unifies parameter syntax, default values, .Children usage, and multi-parameter filtering
Query Output Configuration - Groups column ordering, index mapping, renaming, and optimization
Testing and Validation - Combines Schema Workbench testing, CDA preview, troubleshooting, and iterative development
By the end of this workshop, you'll have created a sophisticated, fully functional telecommunications analytics dashboard that demonstrates enterprise-grade CTools development practices. You'll understand how to architect complex dashboards that integrate OLAP analysis, dynamic parameter passing, calculated metrics with temporal comparisons, and multi-component interactivity.
Prerequisites: Pentaho Business Analytics Server with CTools installed, PostgreSQL with baseline_demo database configured, Schema Workbench with PostgreSQL JDBC driver, Wireless Carrier Mondrian schema XML file available, administrative access to Pentaho User Console Estimated Time: 90 minutes
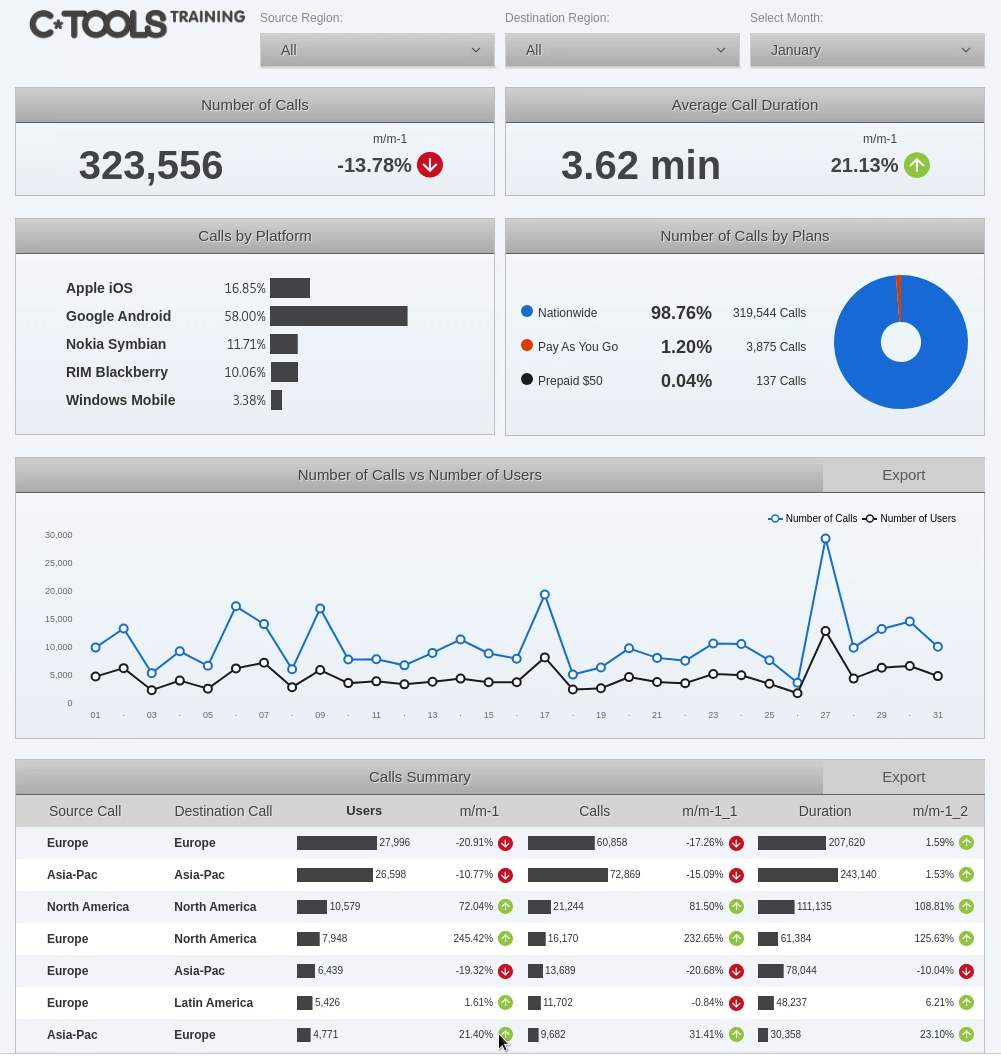
Before we begin our dashboard journey, we need to understand our OLAP Mondrian datasource.
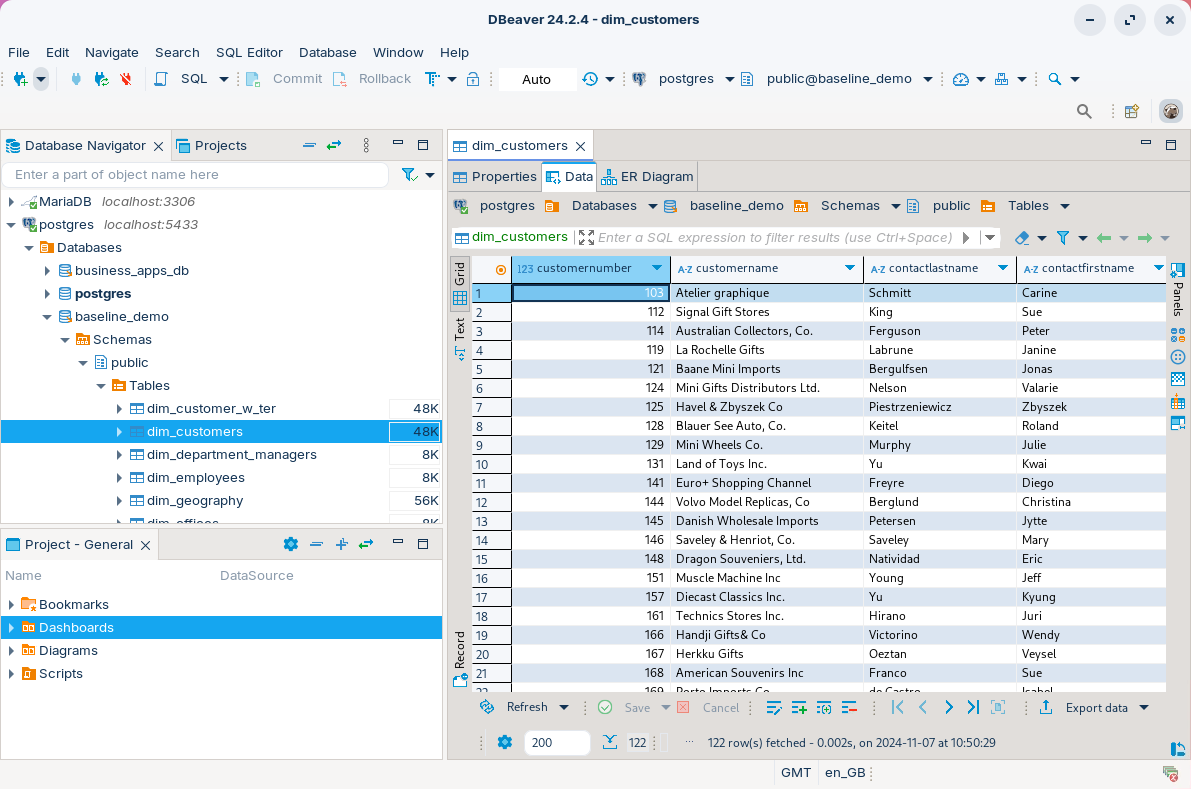
Log into the Postgres baseline_demo database.
The baseline_demo database has a number of key features:
• Centralized Fact Tables
• Dimension Tables (sometimes called lookup tables)
• Simple Join Paths
• Denormalized Structure
• Query Optimization Features
These tables have been 'mapped' using Pentaho Schema Workbench.
You will need to copy over the Postgres database driver to: /schema-workbench/lib
Start Schema Workbench.
Open: Workshop--Ctools/Carrier/schema/Wireless carrier.mondrian.xml
Expand: Retail Sales & Call Corridor cubes - our datasources.
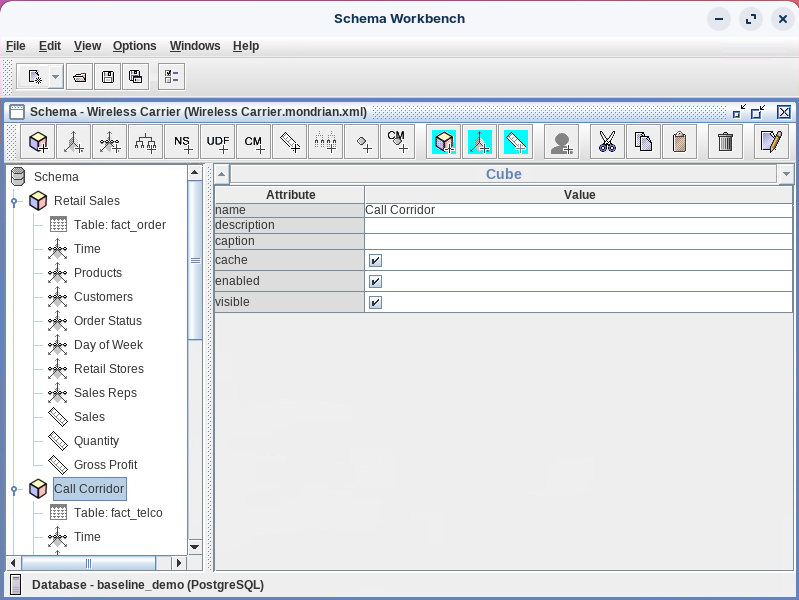
You can test your MDX queries that will be used to populate the dashboard.
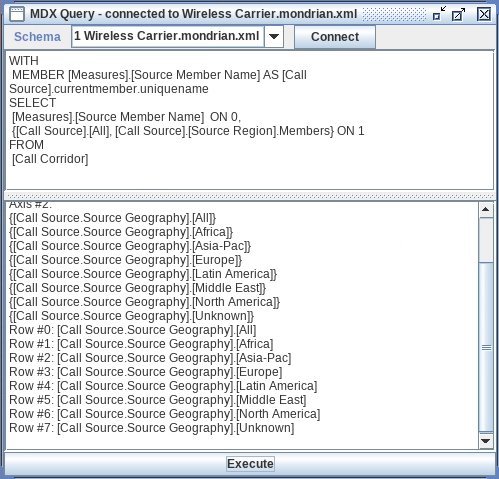
Open the MDX query panel: File -> New -> MDX Query
Copy & paste the following MDX query. Execute.
The last step is to from the Pentaho Server - PUC
• define a connection to the baseline_demo databse
• upload the Wireless carrier Mondrian Schema
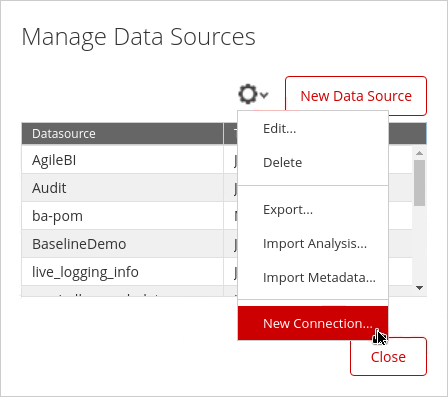
In the PUC select: Manage Data Sources.
Click on the cog wheel & select: New Connection.
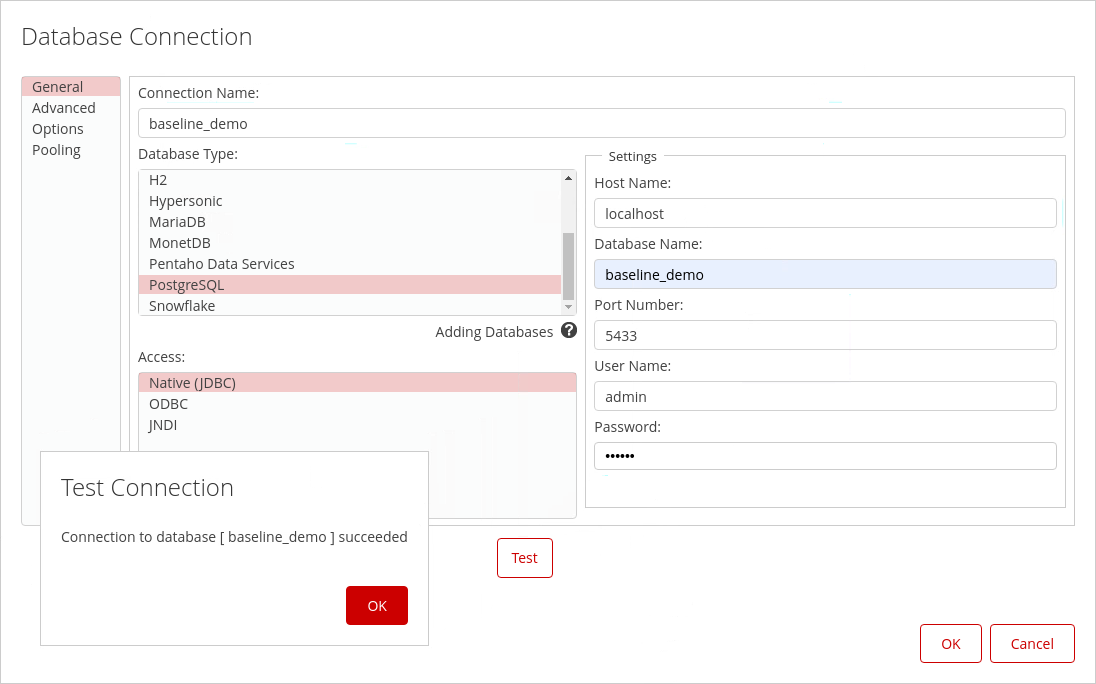
Select Postgres and enter the following details:
The Manage Data Sources also has the option to: Import Analysis
Browse to: Workshop--CTools/schemas/Wireless Carrier.Mondian.xml and associate with baseline_demo datasource.
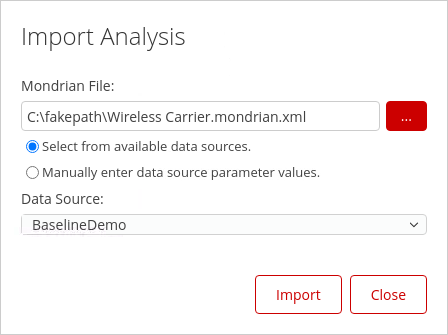
Click: Import & check the xml schema has been successfully imported.
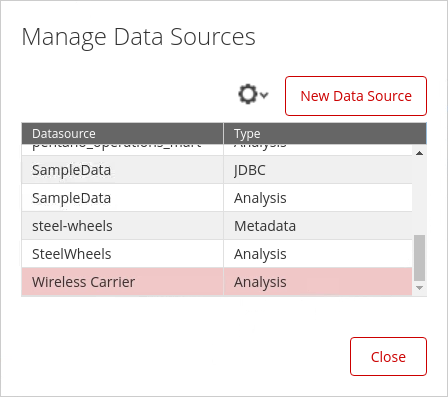
The schema can now be referenced to create the dashboard mdx.mondrian.jndi queries.
We're going to make a few assumptions here ..
• connections tested
• the layout has been confirmed
• chart content & types agreed
• dashboard functions included - export graphs & tables
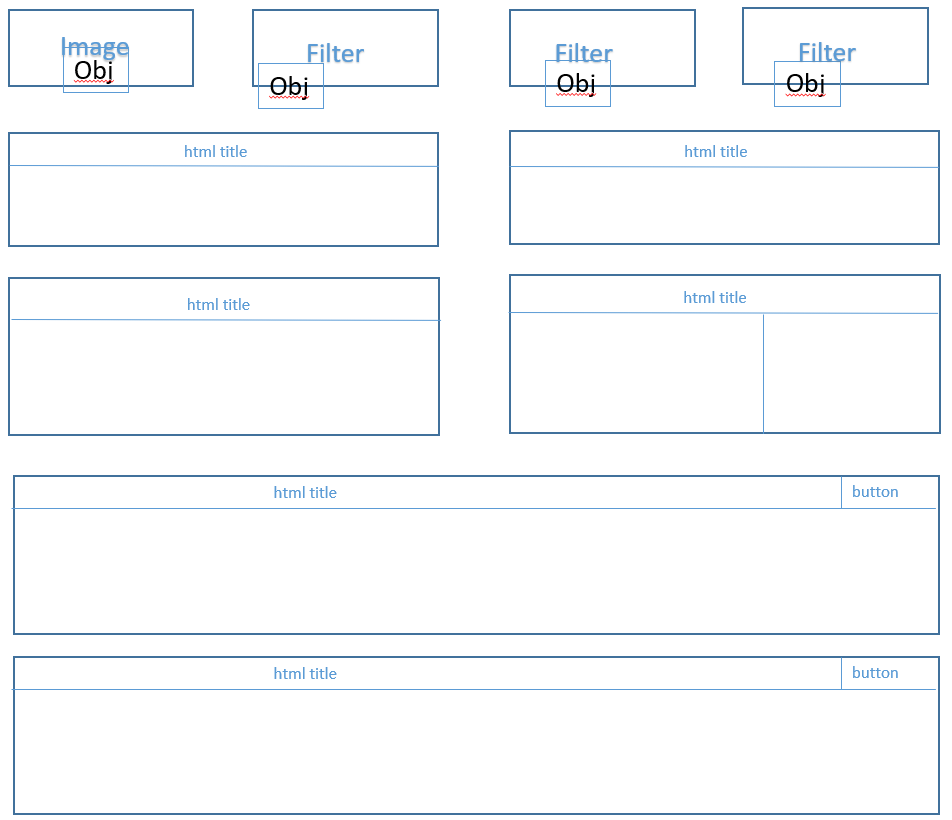
There are five “main” rows:
The first row contains four columns: one with the logo, and three with the selectors.
The second row contains two columns with the main KPIs: Number of Calls and Average Call Duration. Each column contains two rows: one for the header, and another for the data.
The third row has two columns, each with two rows.
The fourth and fifth rows have one column which contains two rows, but notice that the first row is split into two columns because there is a title and an Export button.
Highlight: /Public/CTools-Dashboard/Carrier-Dashboard-Layout/Layout.
Select: Edit from the Folder Actions.
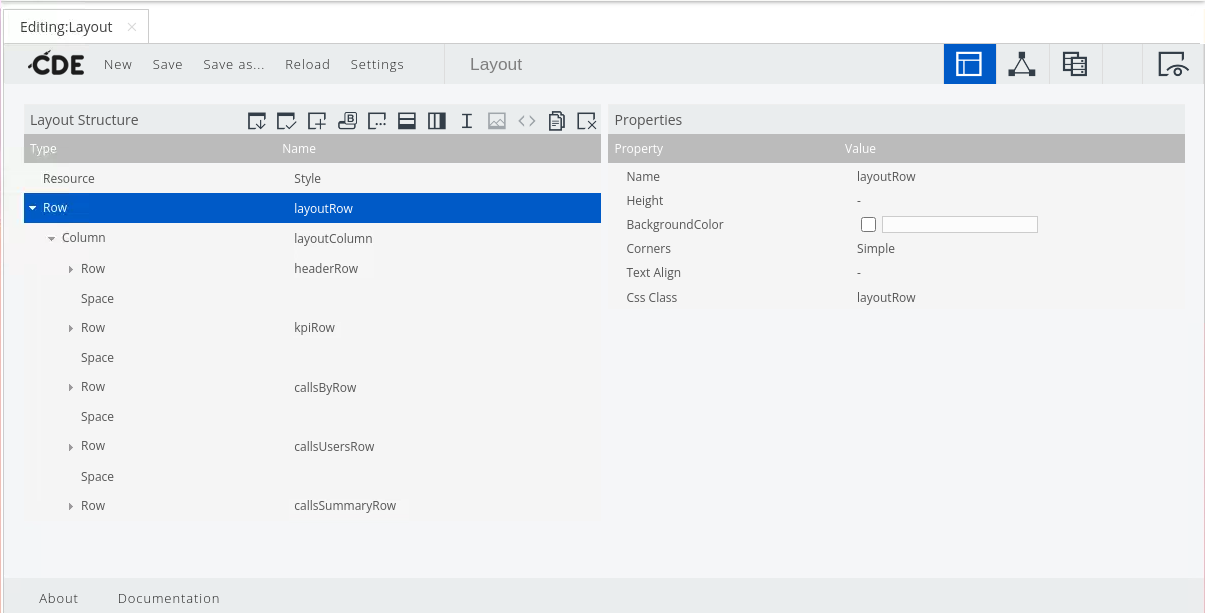
Keep the Layout dashboard open in its own tab.
You will need to refer to each Layout entity to apply the Property Values.
Create a Layout folder in the PUC .. give it a go ..!
Most modern day layout are controlled by Cascading Style Sheets (CSS)
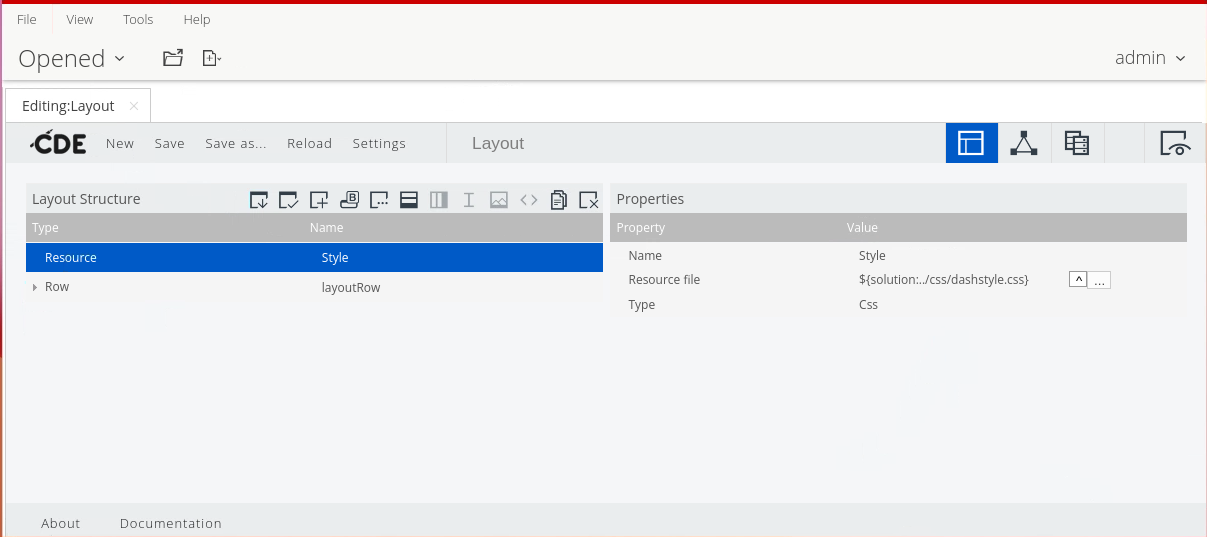
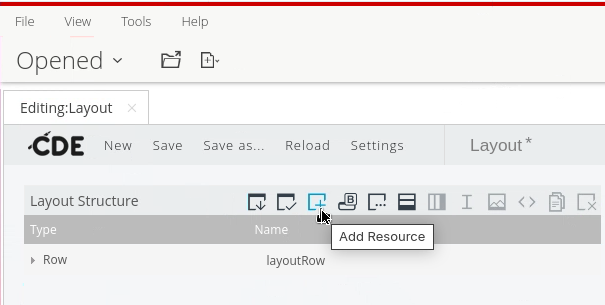
Click on the Add Resource option in the Layout Structure toolbar.
Enter the following options:
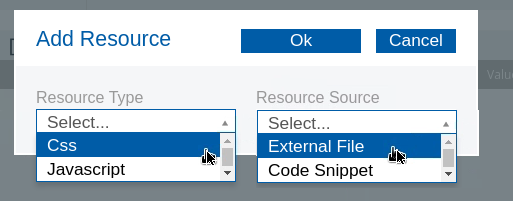
Click on the ^ button and browse for the file.

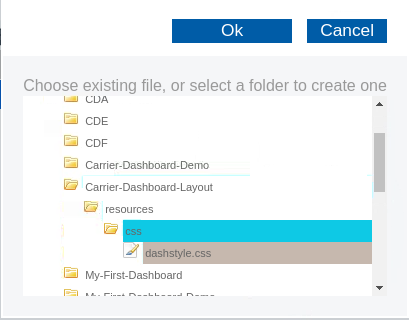
Finally check the CSS has been applied.
Save & Preview the dashboard.
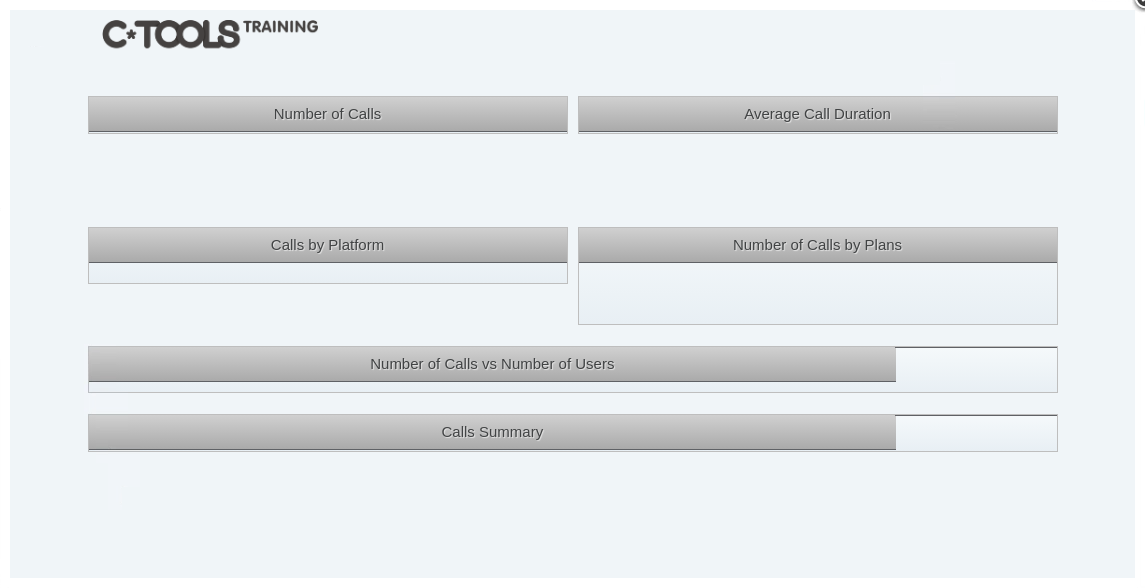
The completed workshop:
/Public/CTools-Dashboard/Carrier-Dashboard-Layout/Layout
Now that the Layout is complete, time to turn our attention to CDA data sources.
All the data in this dashboard comes from ten MDX queries.
The three selectors:
• Source Region
• Destination Region
• Month
are all populated via MDX queries, as are each of the tables and charts in the dashboard.
We're going to add two MDX queries to the dashboard.
• First query returns the values for the Source Selector.
• Second query returns the results for the main dashboard table that includes several defined parameters.
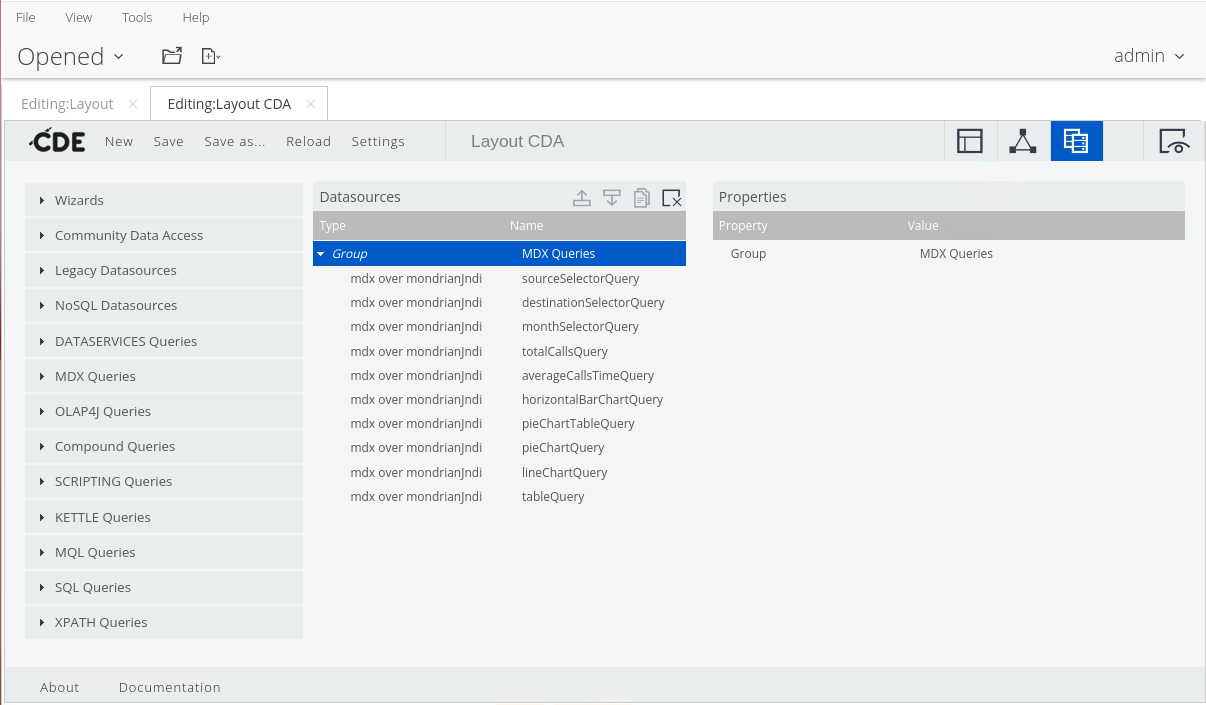
Let's start with the MDX query that retrieves the list of Regions.
Start with the Layout dashboard ..
Layout
Browse to: /Public/CTools Dashboard/Carrier-Dashboard-CDA/Layout
Click Edit under File Actions.

On the CDE Perspectives Toolbar, click the Data Sources Panel icon.
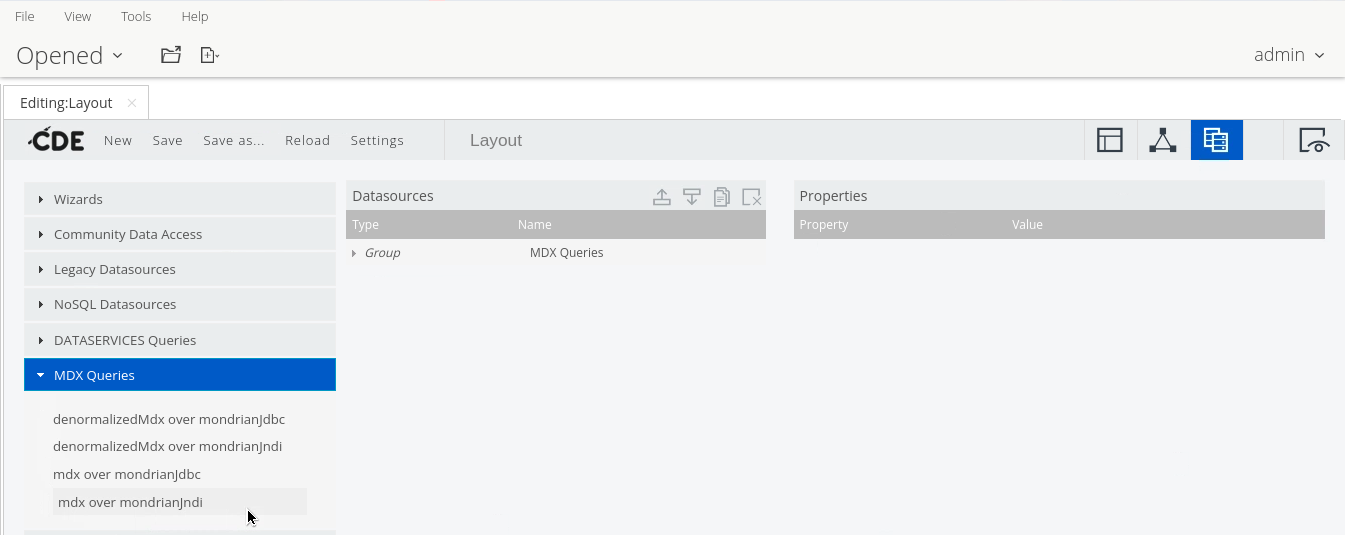
From the Data Source list, expand MDX Queries, and then click mdx over mondrianjndi.
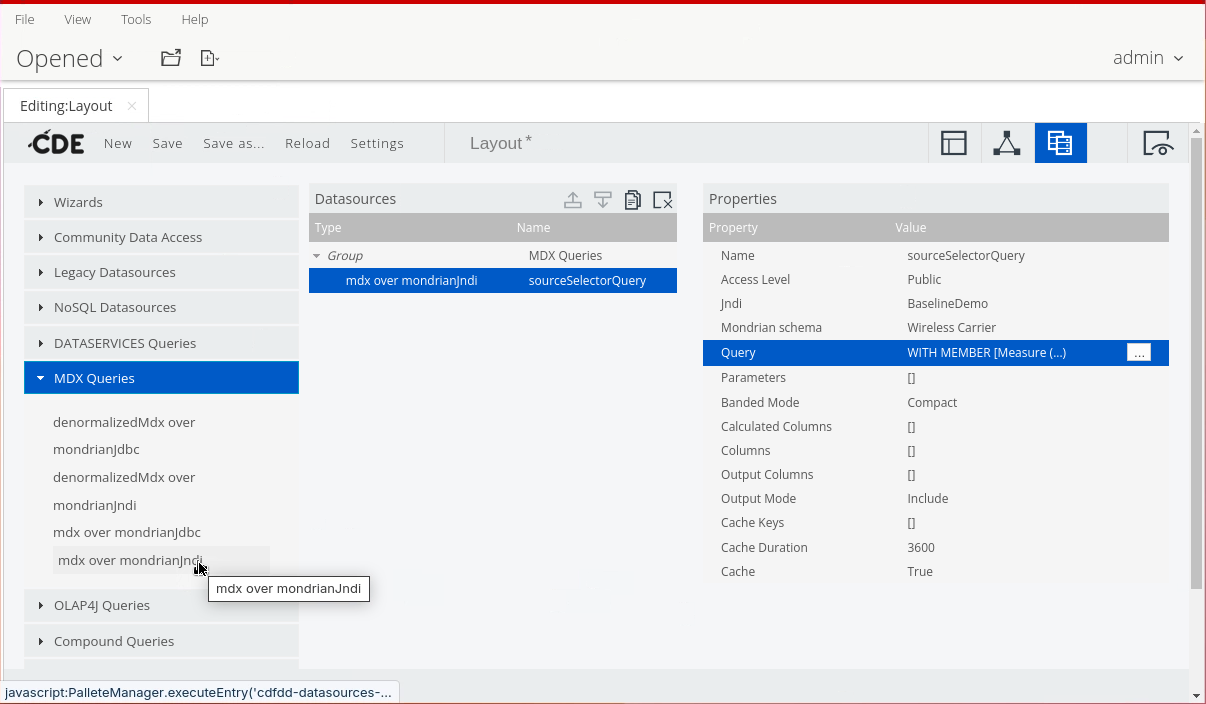
To name this data source, in the Properties pane:
• Click in the Value for the Name property.
• Type sourceSelectorQuery.
• Press Tab or Enter.
Its BP to add the suffix “Query” to the data source name.
In the Properties pane:
• Click in the Value for the Jndi property.
• On the keyboard, press the down arrow.
• Select the BaselineDemo connection.
In the Properties pane:
• Click in the Value for the Mondrian schema property.
• On the keyboard, press the down arrow.
• Select the Wireless Carrier schema.
To enter the MDX query:
• In the Properties pane, click the ellipsis icon to the right of the Query property.
• In the MDX Editor window, enter the following MDX query, and then click OK:
The query creates a calculated member (Source Member Name) and obtains the list of Source Regions from the Call Source dimension.
Save & Test the Layout.cda
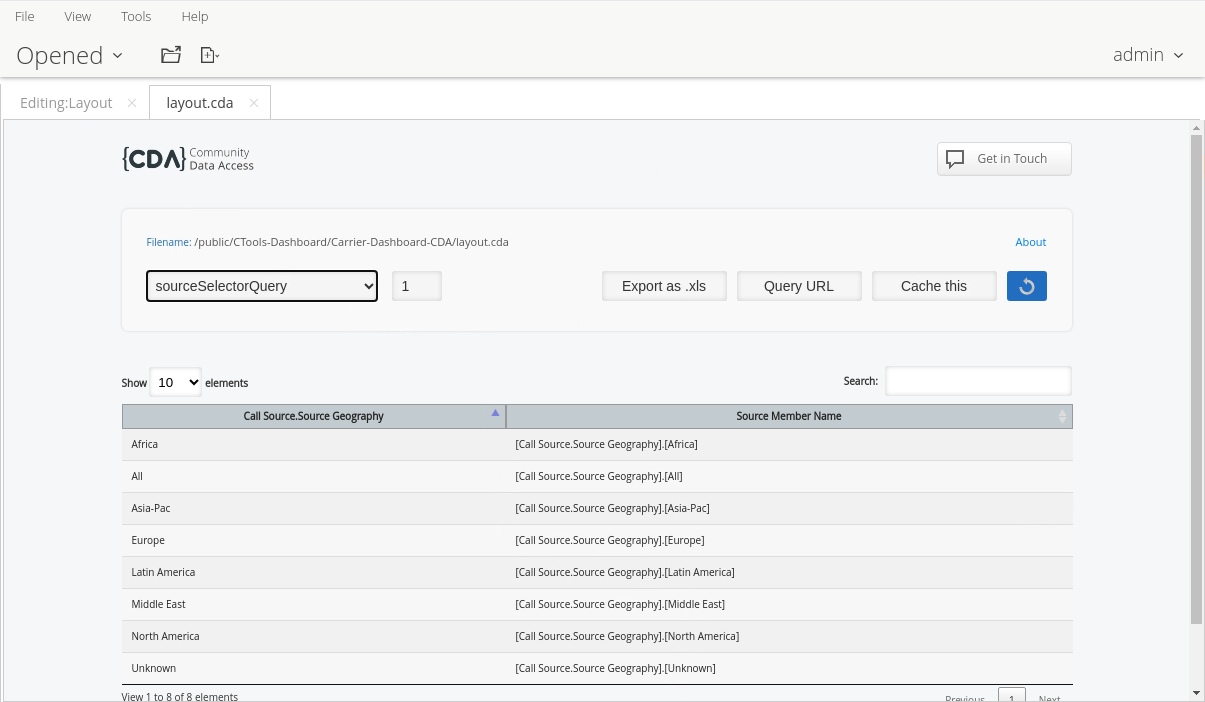
OOOOps the columns are the wrong way around ..
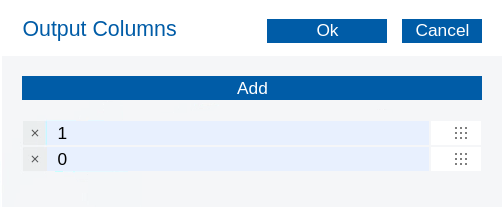
To change the order of the columns:
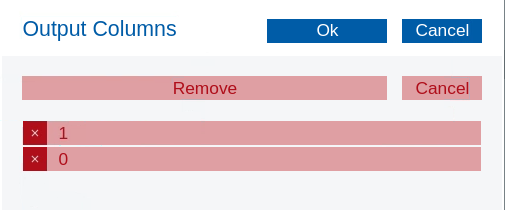
• In the Properties pane, click in the Value for the Output Columns property.
• In the new window, click the Add button once to add another field.
• In the first Index field, type 1.
• In the second Index field, type 0.
• Click OK.
Save the dashboard and try again .. Refresh the layout.cda
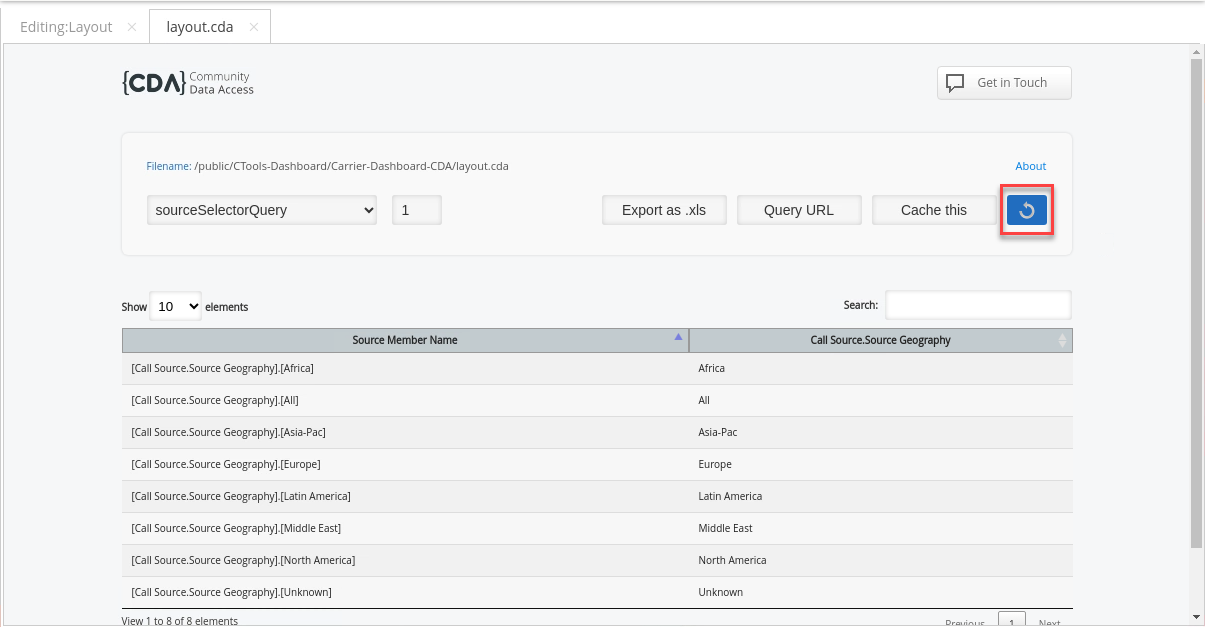
Notice the Query has also returned an 'Unknown' Geography value .. This indicates that the Geography table in the baseline_demo database contains errors.
The completed workshop:
/Public/CTools-Dashboard/Carrier-Dashboard-Layout/Layout CDA
Next MDX query populates the main dashboard table. This query is a bit trickier as it includes parameters ..
Duplicate the sourceSelectorQuery and change the name to tableQuery.

Delete the Output columns.
Add the MDX Query.
It's out of scope to explain how MDX queries work , however, let's break this Query down into the various parts to hep explain whats happening behind the scenes:
Calculated Members Definition: The query starts by defining several calculated members in three groups (users, calls, and time), each following the same pattern:
Users:
Calls:
Duration:
The IIf Logic: Each "difference" measure uses IIf(IsEmpty()) to handle null cases.
This prevents division by zero errors and returns NULL if current month data is empty.
SELECT Statement:
On COLUMNS: Shows the current values and their percentage differences for users, calls, and duration
On ROWS: Uses CROSSJOIN to combine two dimensions:
${sourceCallParameter}${sourceChildren} (likely source locations/departments)
${destinationCallParameter}${destinationChildren} (likely destination locations/departments)
Template Parameters:
The query uses several parameters (denoted by ${...}):
${monthParameter}: Specifies the current month
${sourceCallParameter}: Source dimension
${sourceChildren}: Additional source hierarchy members
${destinationCallParameter}: Destination dimension
${destinationChildren}: Additional destination hierarchy members
From Clause: The data comes from a cube named [Call Corridor], which tracks call metrics between different locations.
The query is designed to display month-over-month comparisons of:
• Number of users
• Number of calls
• Total call duration
Each with their corresponding percentage changes, broken down by source and destination locations.
To specify default values for the parameters:
• In the Properties pane, click in the Value column for the Parameters property.
• In the new window, click the Add button four times.
• In the Name and Value columns, type the following:
destinationCallParameter
[Call Destination.Destination Geography].[All]
sourceCallParameter
[Call Source.Source Geography].[All]
monthParameter
[Time.Standard Time].[2011].[Q1 2011].[January]
sourceChildren
.Children
destinationChildren
.Children
.Children returns all the direct child members of a given member in a hierarchy. When used with crossjoined tables, it returns the immediate descendants of the specified level or member.
To see the new results in CDA:
• From the Opened perspective, click the layout.cda tab.
• Right-click the layout.cda tab.
• From the menu, select Reload Tab.
• In the Confirm Reload dialog, click Yes.
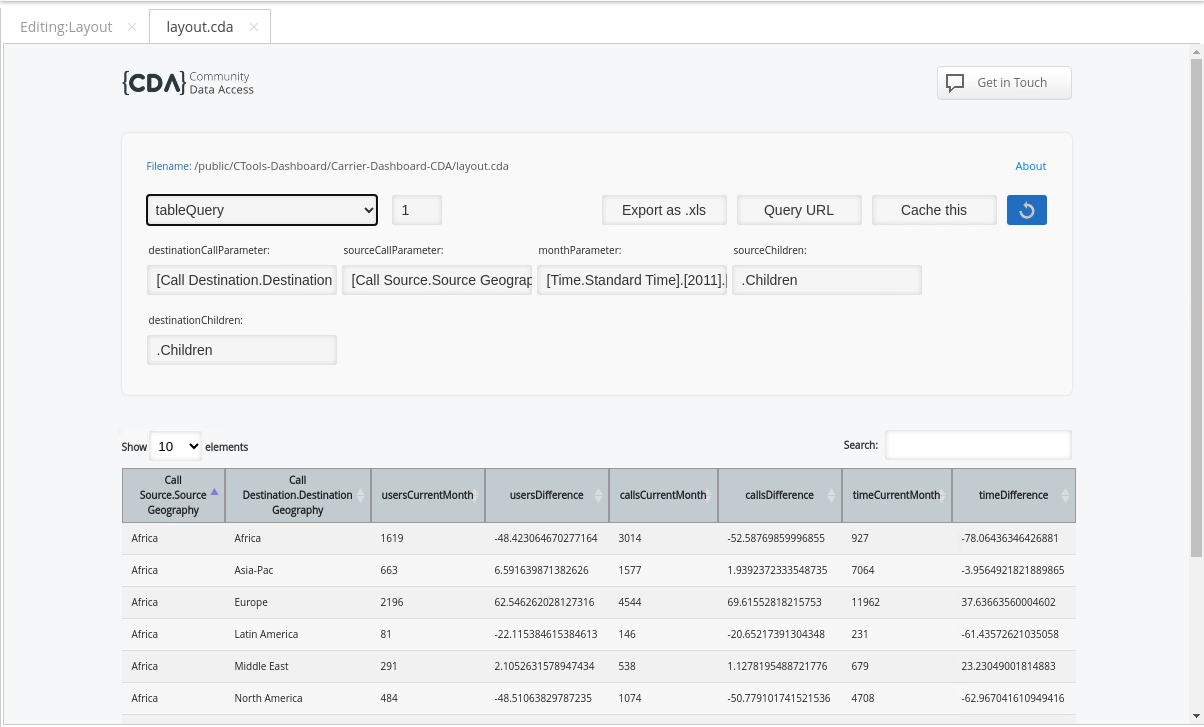
The column names and data formats are not ideal. We will improve the appearance of the data when we create the table later.
For now let's modify the column names for the tableQuery.
To specify column names for the query output:
• In the Properties pane, click in the Value column for the Columns property.
• In the new window, click the Add button seven times.
• In the Index and Name columns type the following, and then press OK.
0
Source Call
1
Destination Call
2
Users
3
m/m-1
4
Calls
5
m/m-1
6
Duration
7
m/m-1
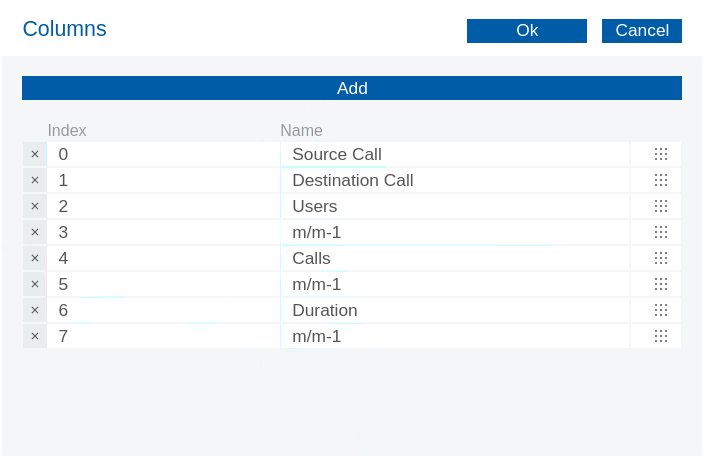
Save and again check in CDA dashboard.
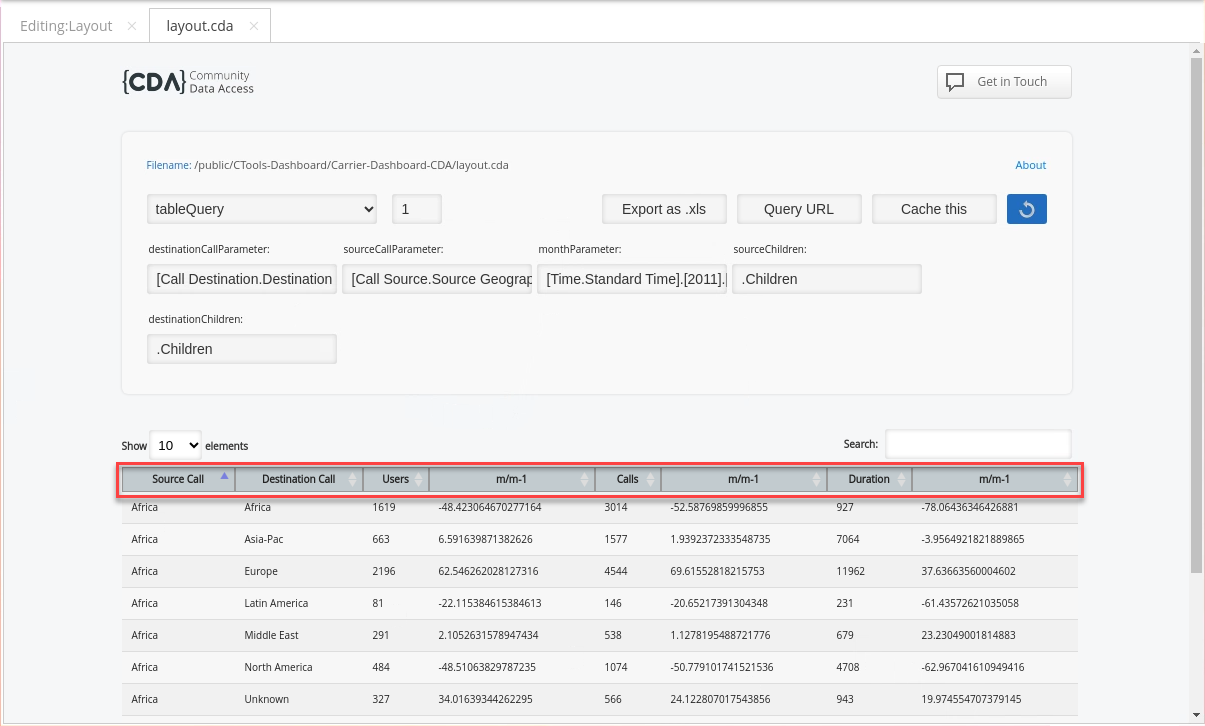
The completed workshop:
/Public/CTools-Dashboard/Carrier-Dashboard-Layout/Layout CDA
The lineChartQuery
Duplicate the tableQuery and rename to: lineChartQuery.
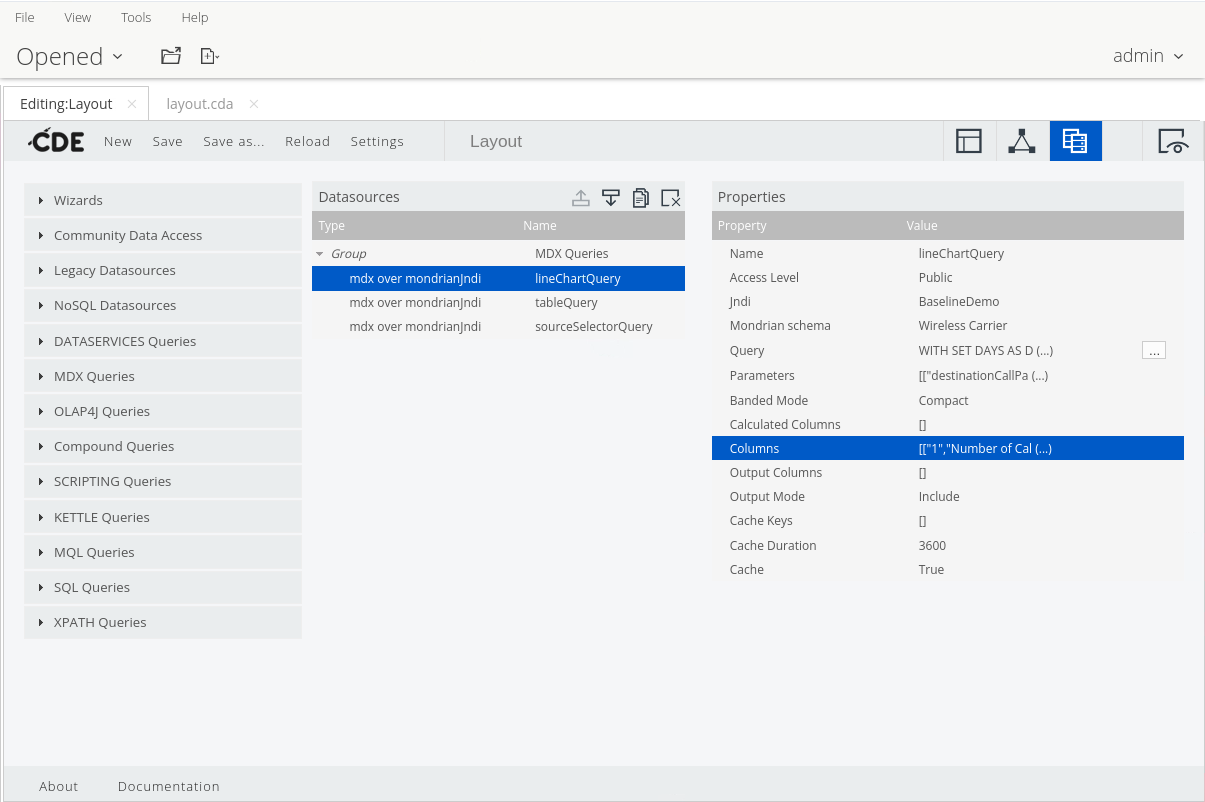
Replace the existing MDX query:
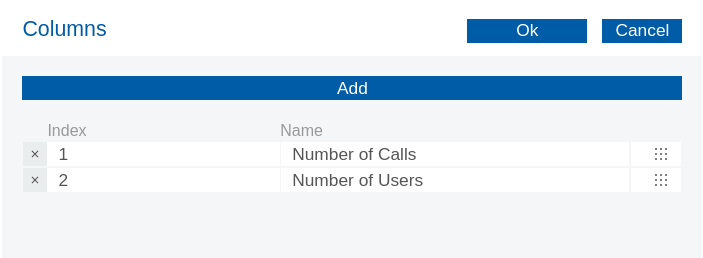
To edit/delete the column names:
• Click in the Value column for the Columns property.
• To the left of Index 0, click the delete icon.
• Click Remove.
• Change Index 1 to Number of Calls.
• Change Index 2 to Number of Users.
• Delete the remaining column names.
• Click OK.
Save and view in CDA Dashboard.
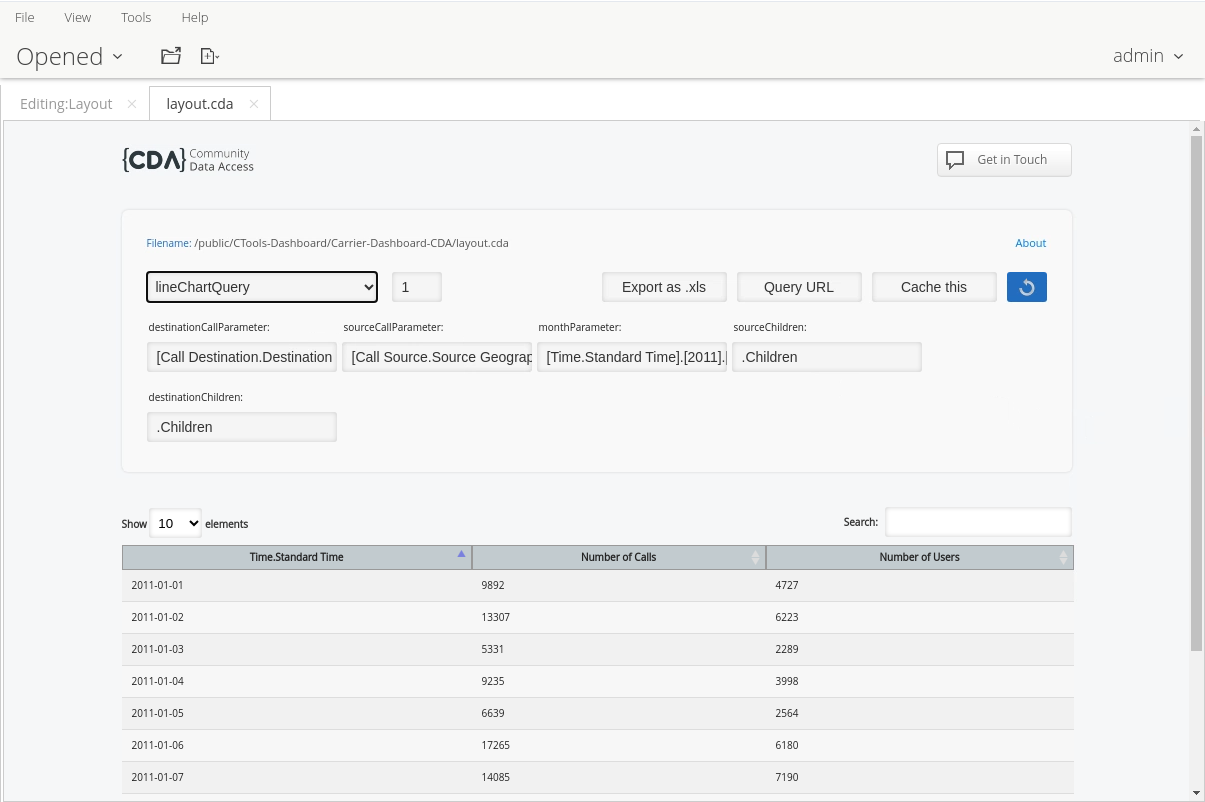
The completed workshop:
/Public/CTools-Dashboard/Carrier-Dashboard-Layout/Layout CDA
Last updated
Was this helpful?
