> For the complete documentation index, see [llms.txt](https://academy.pentaho.com/llms.txt). Markdown versions of documentation pages are available by appending `.md` to page URLs; this page is available as [Markdown](https://academy.pentaho.com/pentaho-ctools/c-tools/community-graphics-generator.md).
# Community Graphics Generator
{% hint style="info" %}
The Community Graphics Generator (CGG) is a powerful tool within CTools designed to generate static images from charts and visualizations. It's primarily used when you need to create static snapshots of dashboard visualizations, which is particularly useful for email reports, PDF exports, or scheduled report generation.
CGG works by rendering charts server-side, supporting various output formats including PNG, JPG, and SVG. It integrates seamlessly with other Pentaho components like CDA for data access and CDE for dashboard integration. You can trigger CGG through URL parameters, making it flexible for different use cases, such as scheduled reports or on-demand generation.
{% endhint %}
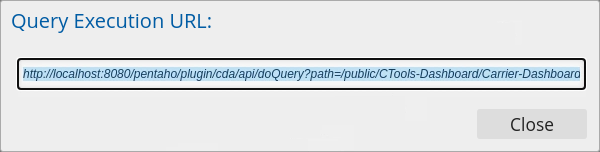
URL for tableQuery
{% hint style="info" %}
The tool is especially valuable in scenarios where interactive visualizations aren't practical or when you need to distribute reports to users without direct access to Pentaho dashboards. It supports batch processing, high-resolution outputs, and can be automated through scheduling. This makes it an essential component for enterprise reporting scenarios where static image generation of charts and graphs is required.
• Key technical capabilities include:
• Server-side processing with memory and resource management
• Multiple output formats (PNG, JPG, SVG) with customizable DPI settings
• Integration with CDA for data access and query handling
• Support for automated report generation and batch processing
• Advanced security features including authentication and access control
• Performance optimization through caching and resource allocation
• Custom scripting support and conditional formatting options
To export a CGG chart, call the URL:
{% endhint %}
```http
http:///pentaho/plugin/cgg/api/services/draw?script=
```
{% hint style="info" %}
Common enterprise applications include automated PDF report generation, email distribution of visualizations, dashboard exports, and document embedding. The tool's ability to handle complex visualizations while maintaining high-quality output makes it particularly valuable in business intelligence and reporting environments where consistent, automated visual reporting is essential.
{% endhint %}
---
# Agent Instructions
This documentation is published with GitBook. GitBook is the documentation platform designed so that both humans and AI agents can read, navigate, and reason over technical content effectively. Learn more at gitbook.com.
## Querying This Documentation
If you need additional information that is not directly available in this page, you can query the documentation dynamically by asking a question.
Perform an HTTP GET request on the current page URL with the `ask` query parameter, and the optional `goal` query parameter:
```
GET https://academy.pentaho.com/pentaho-ctools/c-tools/community-graphics-generator.md?ask=&goal=
```
`ask` is the immediate question: it should be specific, self-contained, and written in natural language.
`goal` is optional and describes the broader end goal you are ultimately trying to accomplish on behalf of the user. GitBook uses it to tailor the answer towards what is most useful for that goal.
The response will contain a direct answer to the question and relevant excerpts and sources from the documentation.
Use this mechanism when the answer is not explicitly present in the current page, you need clarification or additional context, or you want to retrieve related documentation sections.