
Identify the data
Data Dictionaries & Patterns ..
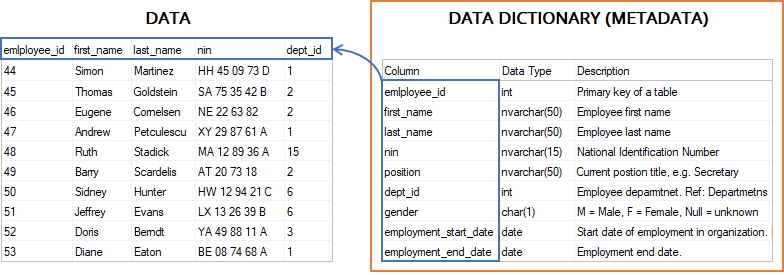
Data Identification: Dictionaries and Pattern Analysis
The data identification process efficiently classifies data by leveraging dictionaries and data pattern analysis. This methodology enables the automatic tagging of data based on predefined criteria in dictionary and pattern configuration files.
While Data Catalog comes equipped with a comprehensive set of dictionaries and patterns, it also offers flexibility by allowing users to create custom dictionaries and pattern analysis configurations. This customization ensures that the data identification process can be tailored to meet the specific requirements of any organization.

Data Dictionaries
A data dictionary in a data catalog is a collection of predefined terms and definitions that help classify and tag data within an organization's datasets. It serves as a reference guide for data terms, helping users understand the meaning, usage, and context of each data element.
By leveraging a data dictionary, organizations can ensure consistency, accuracy, and easier data identification and management across different data sets. Custom dictionaries can also be created to meet specific organizational needs.
Let's run through an example: Marital_Status.
Navigate to the 'Management' tile & click on: Dictionaries.
Search for: Marital_Status

When the data is profiled, in our example: 'marital_status' the value is compared, using a rule, against (with a degree of confidence) the predefined dictionary.
Once matched: Tags - PII, Marital Status, Non-Sensitive are then applied.
Click on the > to View Dictionary

Next -> 1.2 Rules
Understanding a Data Dictionary Rule
A data dictionary rule is a set of criteria defined to automate the process of matching and tagging data within a dataset based on specific attributes. Below is a breakdown of the key components of a data dictionary rule, illustrated by the Marital_Status example:
• Type: Identifies the rule as a dictionary type, used for matching data against a list of predefined terms.
• minSamples: Specifies the minimum number of samples (e.g., 200) that must be present for the rule to be considered applicable. This ensures that there is a sufficient data volume for accurate matching.
• confidenceScore: A formula used to calculate how confidently the data matches the dictionary. This score is a combination of:
• similarity to the dictionary values (*0.9),
• metadataScore which might consider other attributes of the data (*0.1).
• condition: Defines the conditions under which tags are applied. In this case:
• The confidenceScore must be greater than or equal to 70%.
• The columnCardinality (the count of unique values in the column) must be 3 or more.
• actions: The actions to take when the conditions are met. For the Marital_Status, the following tags are applied:
• PII (Personally Identifiable Information),
• Sensitive, with a value of "Marital Status".
The rule actively searches column data for terms listed in the Marital_Status dictionary. If a term matches with sufficient confidenceScore and meets the specified conditions, the column is automatically tagged accordingly, making it easier for organizations to identify and manage sensitive data.
Click on the Rules tab.

[
    {
        "__typename": "dictionariesRules",
        "type": "Dictionary",
        "minSamples": 200,
        "confidenceScore": {
            "+": [
                {
                    "*": [
                        {
                            "var": "similarity"
                        },
                        0.9
                    ]
                },
                {
                    "*": [
                        {
                            "var": "metadataScore"
                        },
                        0.1
                    ]
                }
            ]
        },
        "condition": {
            "and": [
                {
                    ">=": [
                        {
                            "var": "confidenceScore"
                        },
                        "0.7"
                    ]
                },
                {
                    ">=": [
                        {
                            "var": "columnCardinality"
                        },
                        "3"
                    ]
                }
            ]
        },
        "actions": [
            {
                "applyTags": [
                    {
                        "k": "PII"
                    },
                    {
                        "k": "Sensitive",
                        "v": "Marital Status",
                        "t": "sdd;"
                    }
                ]
            }
        ]
    }
]
Basically if a 'confidenceScore' (calculated from the 'similarity' to the dictionary values and the 'columnCardinality') is >= to 70% and Cardinality is >=3 then applyTags:
• PII
• Sensitive
• Marital Status
Next -> 1.3 Import a Dictionary
x
x
x
x
x
x
x
x
Data Patterns
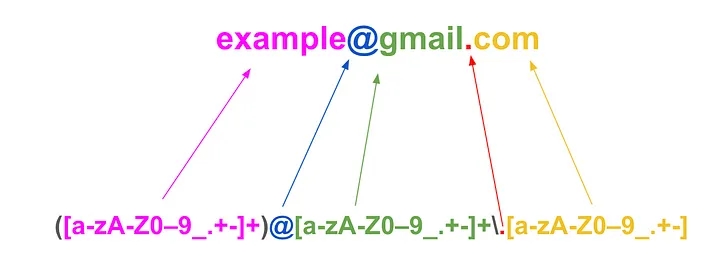
A pattern analysis (or data patterns) document defines the data pattern, regular expression, and column alias(es) and tags that you can use to identify a column of data. You can use data patterns for a variety of purposes, such as regular expression (RegEx) generation, data identification, and data quality checking.
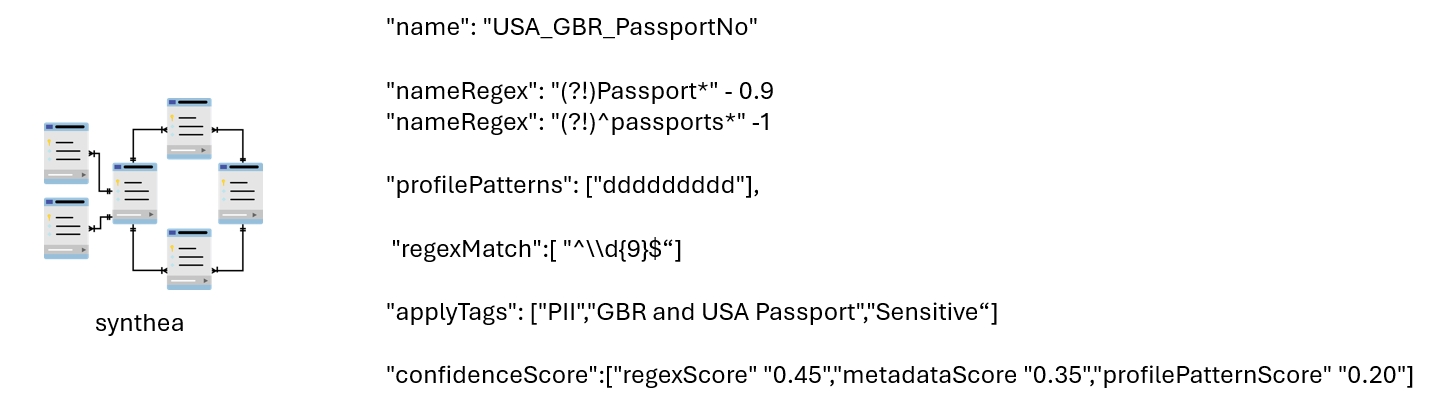
Let's run through an example: USA_GBR_Passport_Numbers.
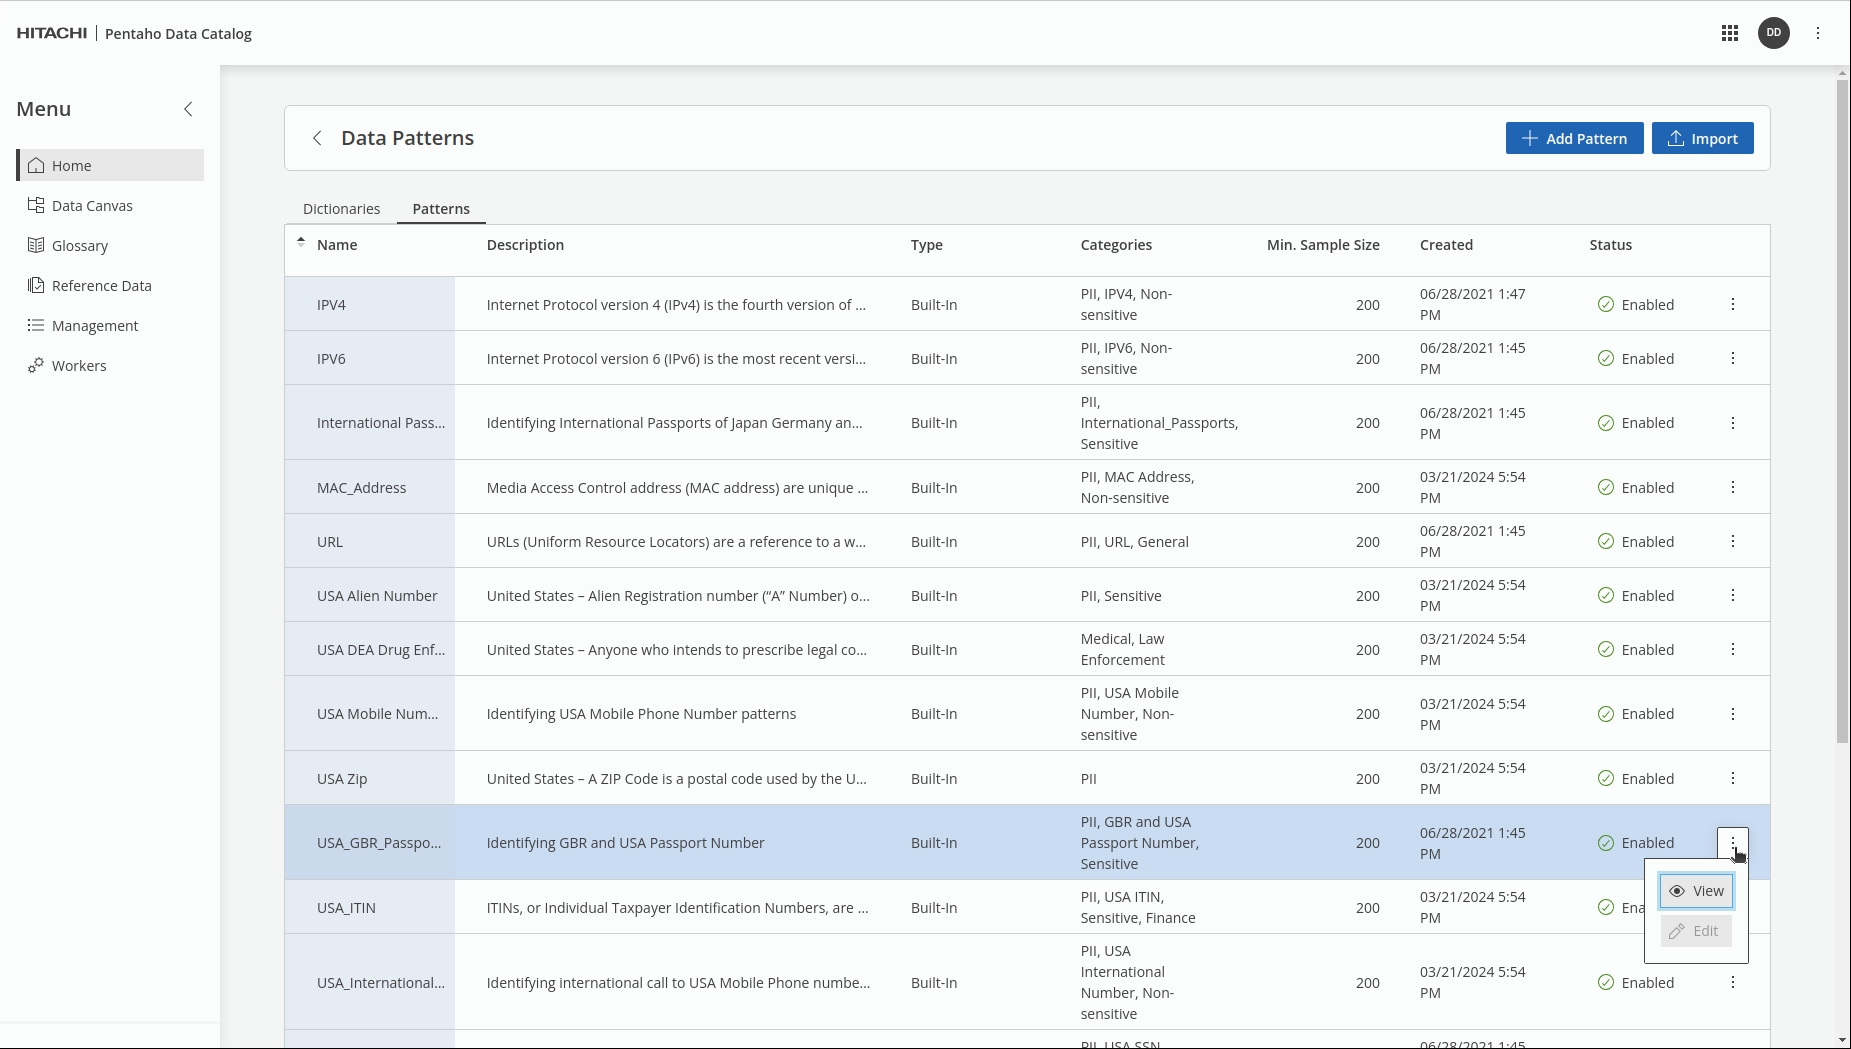
Navigate to the 'Management' tile & click on: patterns.
InSearch for: USA_GBR_Passport_Numbers.
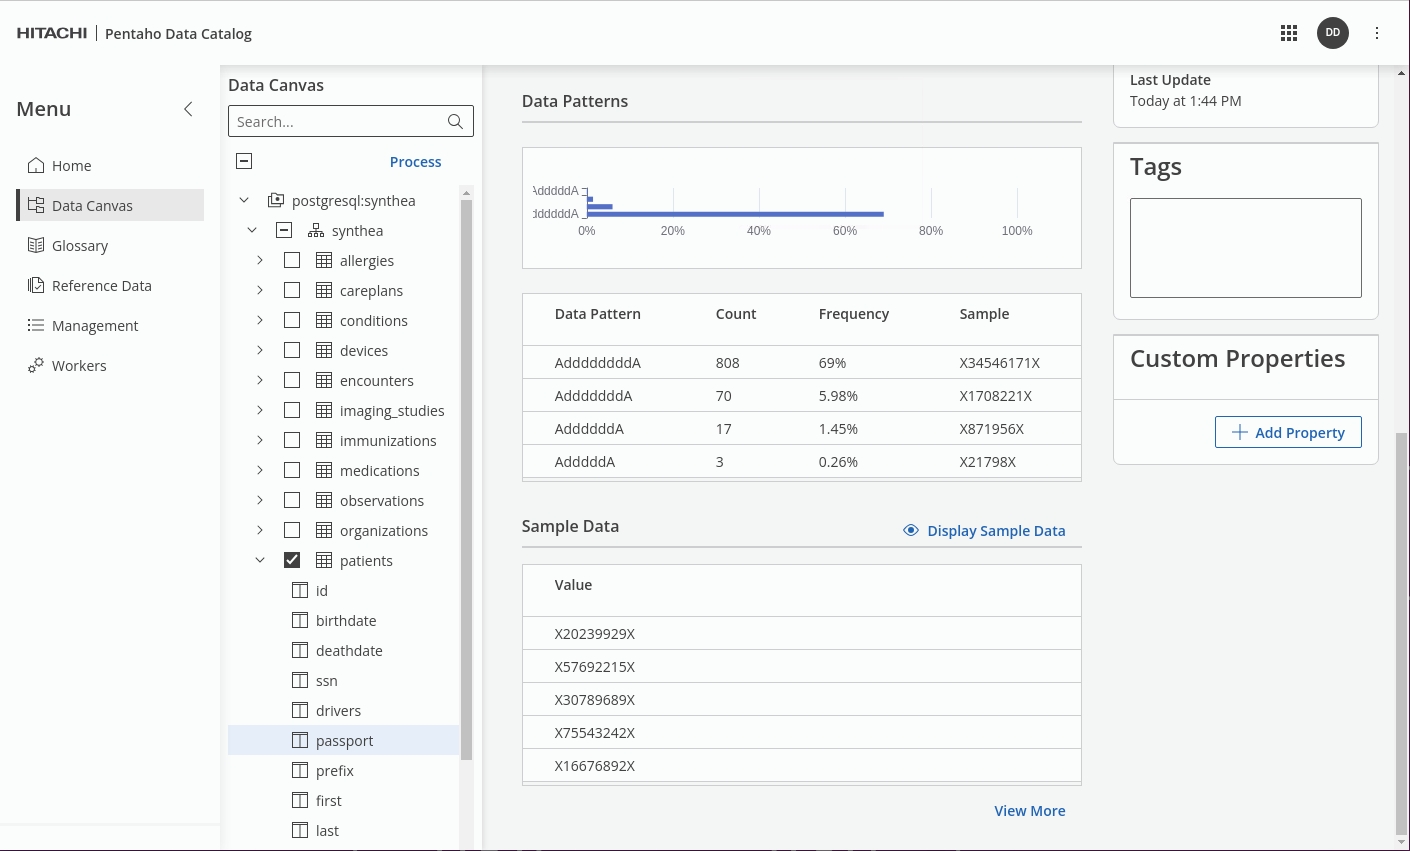
When the data is profiled, in our example: 'passport' the regexMatch will produce a profilePattern that can be compared (with a degree of confidence) against the predefined profilePattern; once matched Tags - PII, GBR and USA Passport, Sensitive are then applied.
Fundamental to data quality analysis is either the use of a regular expression to check data, or to statistically analyze the data itself to find patterns and outlier patterns (which could indicate bad data).
View the data in the Patients table.
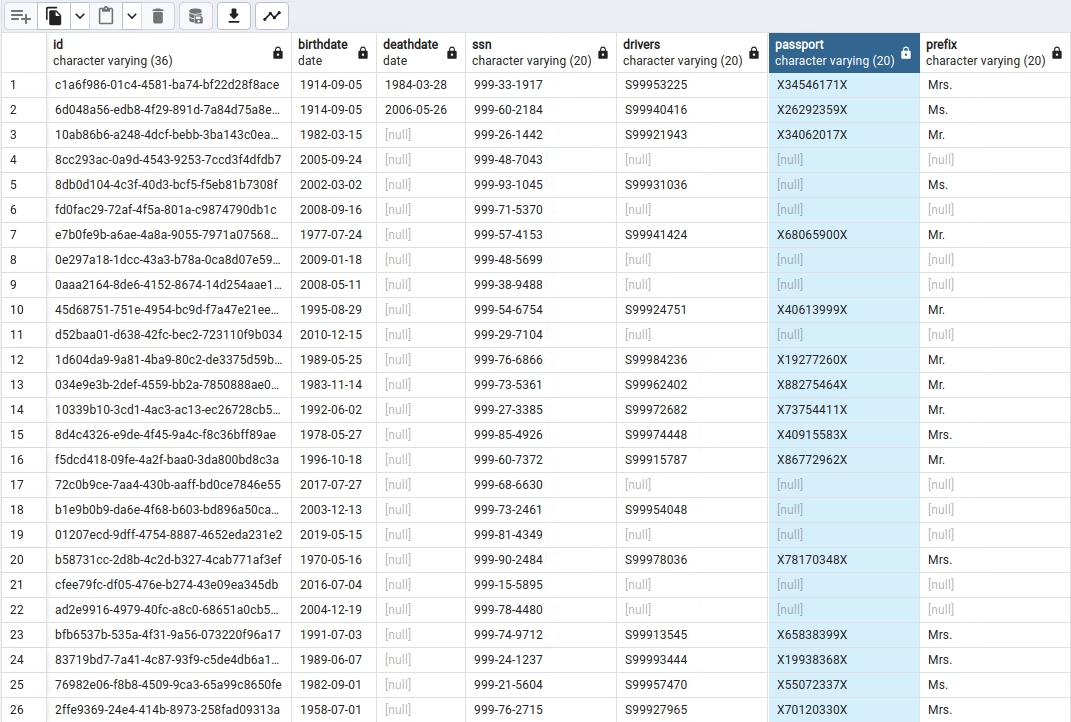
The data identification process generates roughly the top 20 most common patterns which capture the characteristics of the data. You can then use these patterns, along with their statistical frequency and supplementary information, to generate regular expression (RegEx) recommendations for your data. You can tune the RegEx to meet your specific needs, or select valid patterns, so that subsequent data quality checks will identify any data entries that are outside the accepted patterns.
For further information: take a look at Data Patterns in Data Identification Methods.
Next -> 2.2 Rules
x
Policies
The dictionaries and data patterns are together referred to as data identification policies. There are many policies included with Data Catalog, covering categories from a wide range of business sectors, such as Finance, Education, Aviation, Law Enforcement, PCI-DSS and Data Privacy.
After running data identification, you can use the Galaxy View feature to visualize the data tagging, identify the data flow, locate your data, and view the sensitivity and security of that data
Select the following 'Method Names' to define your policy:
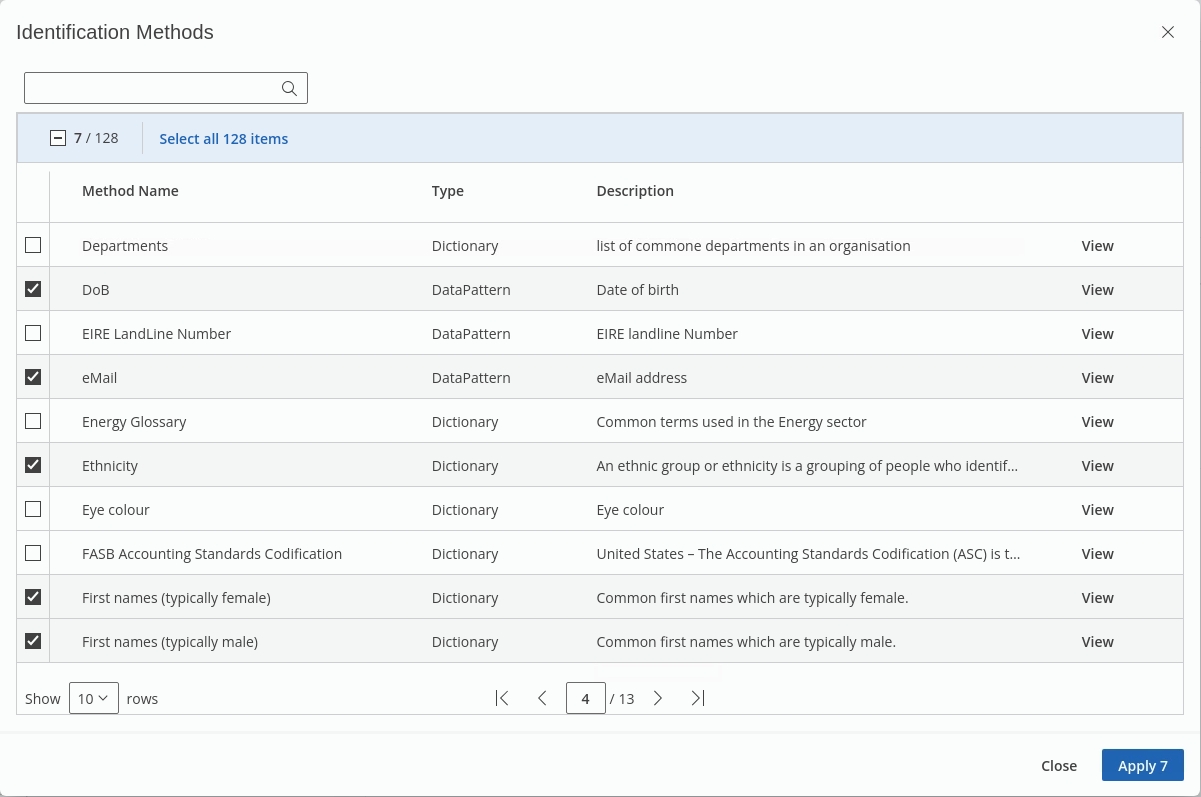
The search bar at the top of the pop-up window can be used to search policies, this feature becomes more helpful as the list of policies grows.
Once the Data Identification step has completed, check the results in the Data Canvas.
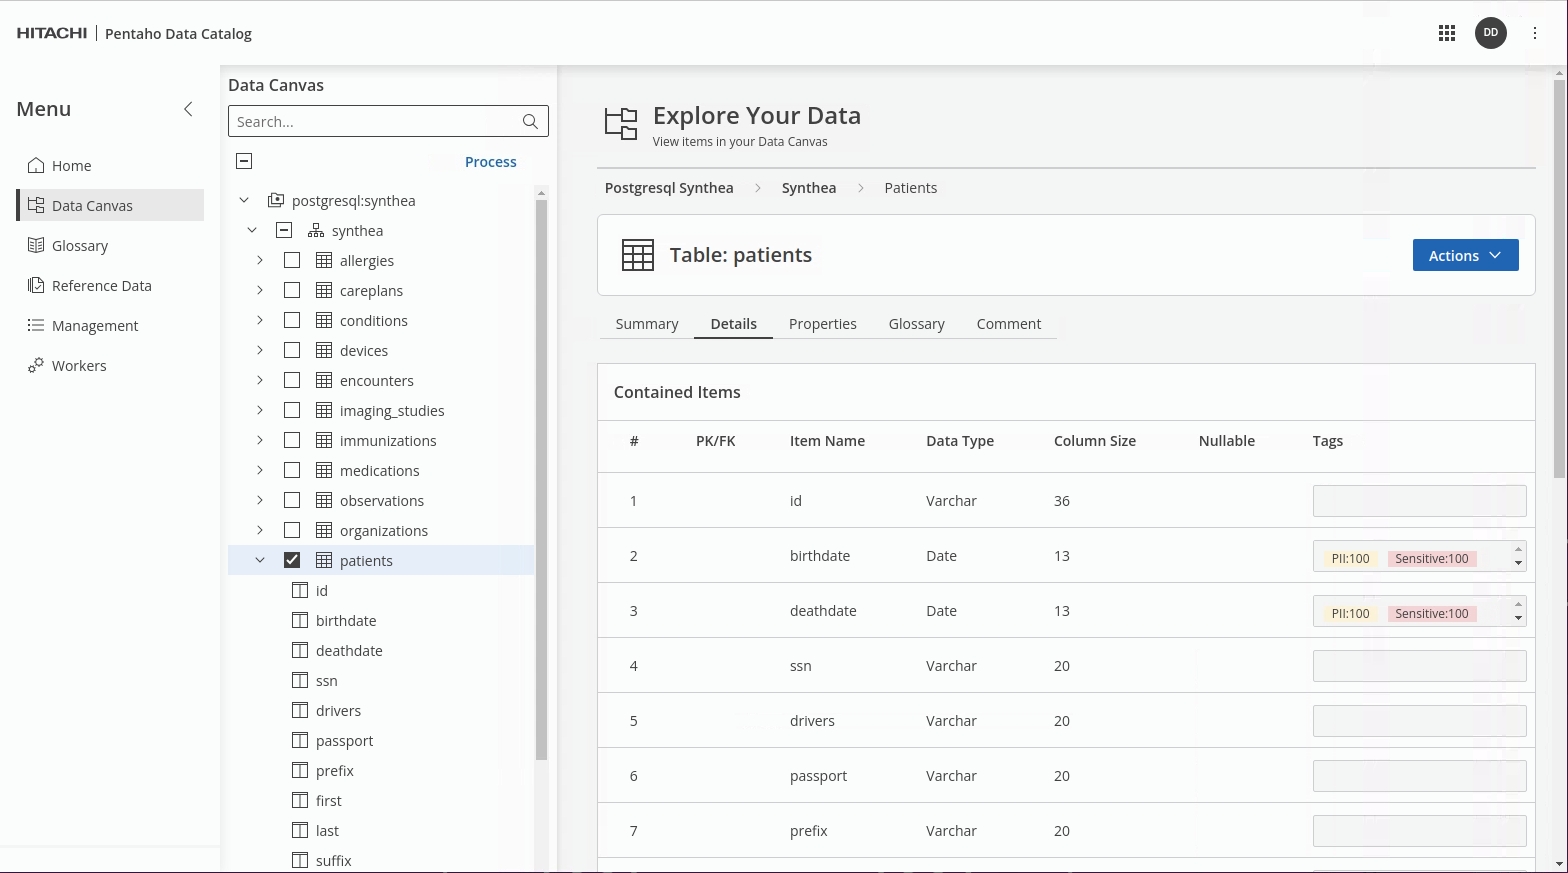
Note the relevant 'patients' fields have now been tagged.
Was this helpful?