
Getting Started
Walk-through of Pentaho Data Catalog ..
Introduction
Pentaho Data Catalog is a powerful tool that enables data engineers, data scientists, and business users to accelerate their data intelligence journey. It automatically discovers, classifies, and contextualizes structured and unstructured data. Here are some key features:
Powerful Business Glossary: Contextualize data with business vocabulary based on governance policies and business rules. This helps activate metadata and ensures alignment with business language.
Data Lineage and Trust: Track data lineage with Open Lineage, building trust as data flows through your organization. Enable data quality and remediation activities.
Observability and Monitoring: A robust observability stack captures popular assets, popular searches, and trends. This helps stewardship organizations focus their energy on the right data.
Integration and Scalability: API-powered integrations with various platforms (NetApp, SAP Hana, S3, SQL views) ensure interoperability. The modern architecture design scales seamlessly.
Enterprise Security: Features include role-based access control (RBAC), password vault support, minimum privileges, multifactor authentication, secure cloud deployments, and no data deduplication.
Discover, understand, and govern your data with Pentaho Data Catalog. It offers faster discovery, lower total cost of ownership (TCO), and improved data quality.
Accessing Your Catalog
To get started using the Data Catalog, log in using the address and credentials provided by your Data Catalog service user or administrator.
To access your catalog, please follow these steps:
Open Google Chrome web browser.
Navigate to:
Enter following email and password, then click Sign In.

Security Advisory: Handling Login Credentials
For enhanced security, it is strongly recommended that users avoid saving their login details directly in web browsers. Browsers may inadvertently autofill these credentials in unrelated fields, posing a security risk.
Best Practice
• Disable Autofill: To mitigate potential risks, users should disable the autofill functionality for login credentials in their browser settings. This preventive measure ensures that sensitive information is not unintentionally exposed or misused.
User Interface
The Pentaho Data Catalog Home page provides a central location for accessing the business tools available to you based on your permissions, such as data canvas, business glossary, applications, policies, management, workers, and so on.
You can also use the menu bar on the left to navigate to different features in the product.

User Menu Bar
The top menu bar is visible from anywhere in Data Catalog.
The following table includes details about its features:
Click the Access Request icon to open the Request Access window. See Request access for information on completing the request.
Click the icon to view your notifications. You can switch your view between Unread and All notifications. A number next to the icon shows how many unread notifications you have.
Click the icon to view your assigned user role and email domain.
Click the icon and select Log Out to log out of Data Catalog.
Click the Documentation link icon to go to the Data Catalog documentation.
Click Edit to open the Landing page options window, where you can configure the landing page with available options in Shortcuts and Tables. Additionally, you can choose to have a vertical or stacked arrangement in Layout. Note: This option is only visible on the Home page.
Left navigation menu
Use the navigation menu bar on the left of the page to access the key features available to you in Data Catalog, depending on your permissions. You can expand and collapse the menu to have a better view.
The following is a list of the menu icons and the features they open:
Returns you to the Home page from your current location in Data Catalog
Browse, search and discoiver data assets.
Explore your data on the Data Canvas page.
Opens the Business Glossary page where you can create, organize, and curate business terms to help you navigate your data.
Opens the Reference Data page., which contains relatively static, unchanging data values that organization commonly uses.
Opens the Master Data page, where you can manage, consolidate, and maintain high-quality master data across the organization.
Opens the Applications page, where you can create, organize, curate, and identify application assets like external applications, groups, and categories to help you understand what type of data is linked from an external application.
Opens the Policy page, where you can access and manage policies that govern how data within Data Catalog is managed, accessed, and used.
Manage your data sources, users, user roles, workers, business rules, schedules, dictionaries, and more in the Manage Your Environment page.
Monitor the data activities’ progress on the Workers page.
Opens the Galaxy View feature, which offers a visual representation of data assets and their relationships.
Quick access cards
When you navigate to the Home page, you can see quick access cards for various Data Catalog features, depending on your permissions. Based on the options selected in the Landing page options window (when you click Edit), it can display the following widgets.

Explore your data
Explore Your Data with the Data Canvas
Dive into the Data Canvas to uncover and analyze your data in depth. This powerful tool provides extensive insights into resource metadata, enhancing your comprehension and illustrating real-world applications. Discover the potential of your data through this intuitive platform.
Once you have processed a dataset ..
Click Data Canvas in the left navigation menu to open the Data Canvas view.
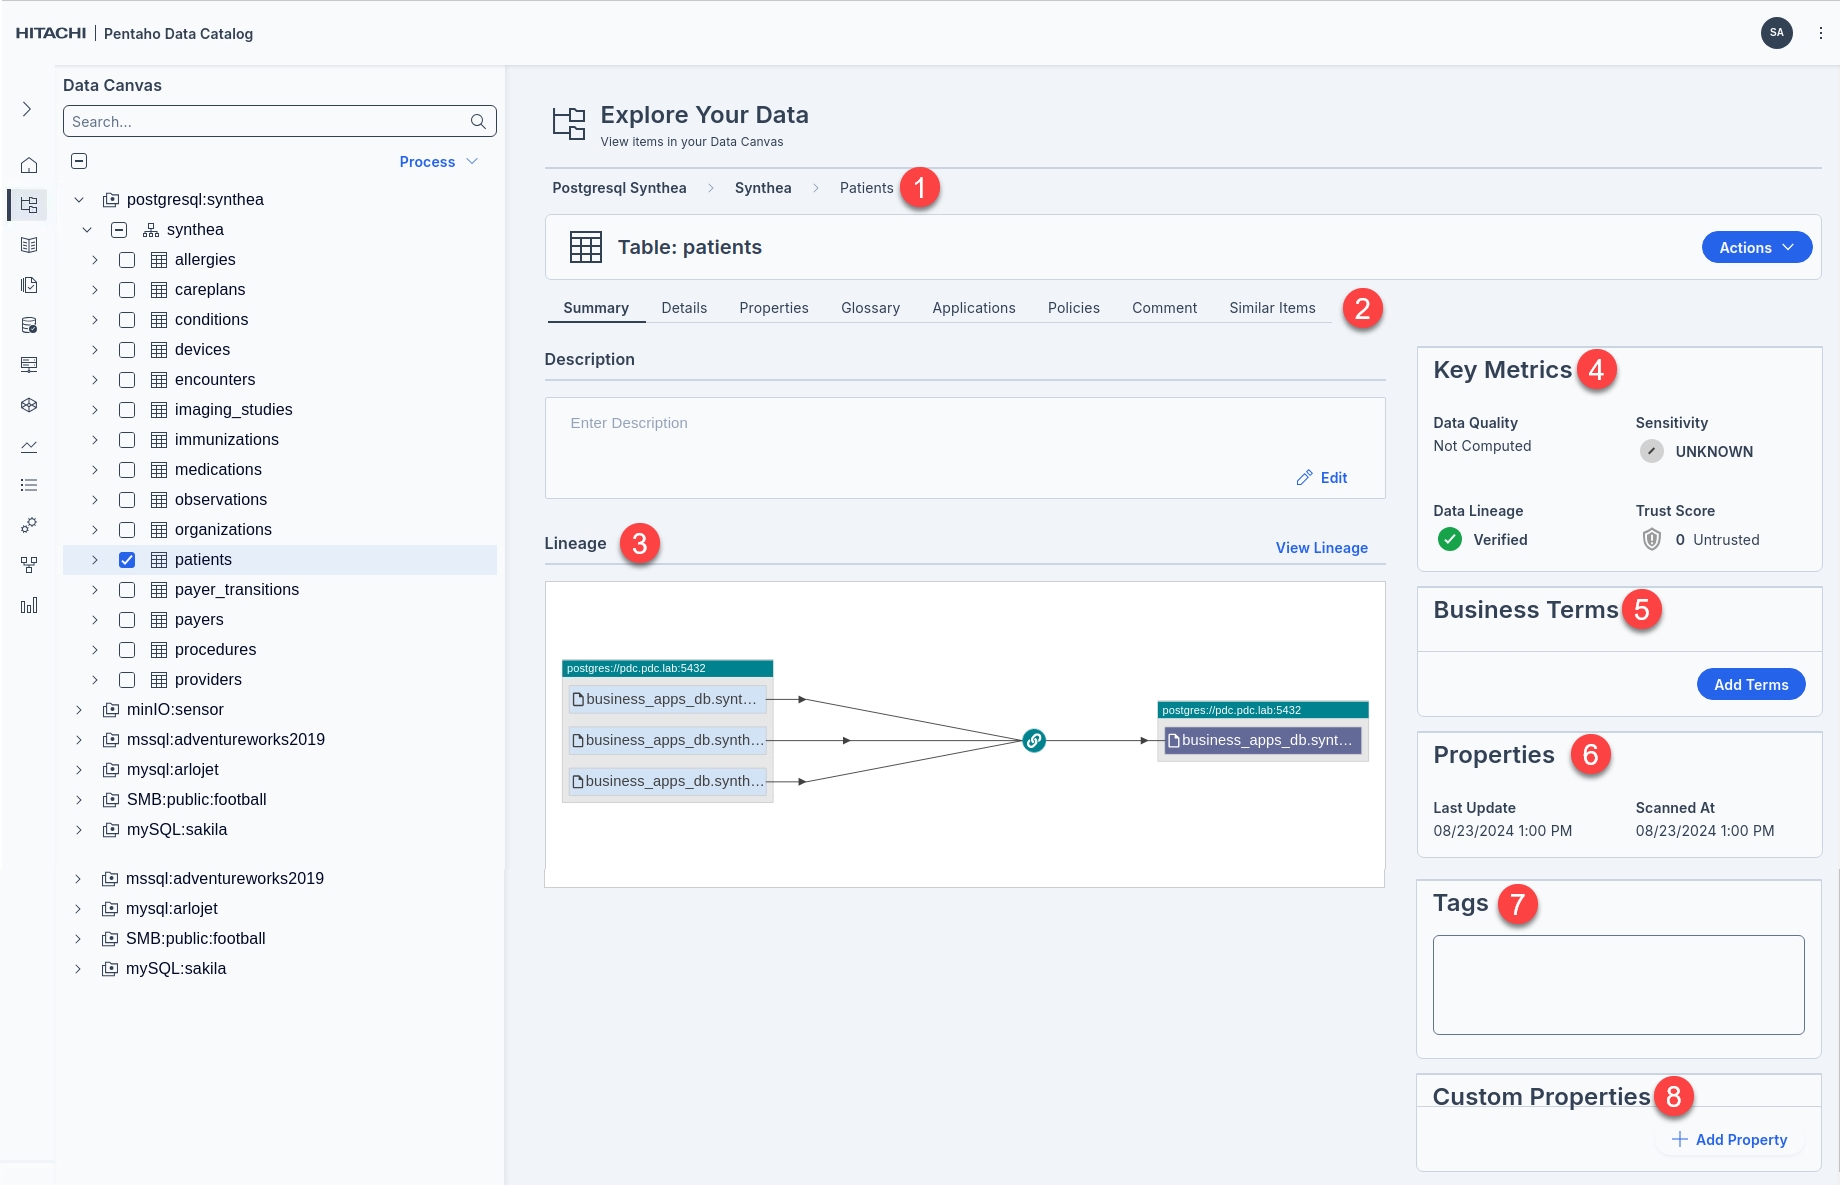
1
Top Navigation
Navigation path. Navigate the tree of data entities to find the one you want to explore in the canvas.
2
Displays information about the selected entity / resource.
3
Data lineage refers to the ability to track the origin and movement of data throughout its lifecycle. Data lineage helps to ensure data accuracy, troubleshoot issues, and meet compliance requirements.
4
Key Metrics
Metrics to indicate the overall Data Quality (pulled from Pentaho Data Quality) of the resource. You can set the Sensitivity & Trust Score
5
Business Terms
You create business terms to standardize definitions of business concepts so that your data is described in a uniform and easily understood way across your enterprise.
Business terms can describe the contents of the data, the sensitivity of the data, or other aspects of the data, such as the subject or purpose of the data. You can assign one or more business terms to individual columns in relational data sets, to other governance artifacts, or to data assets.
6
Properties
Metadata about the asset / resource, for example: 'Last Update' &
7
Tags
8
Custom Properties
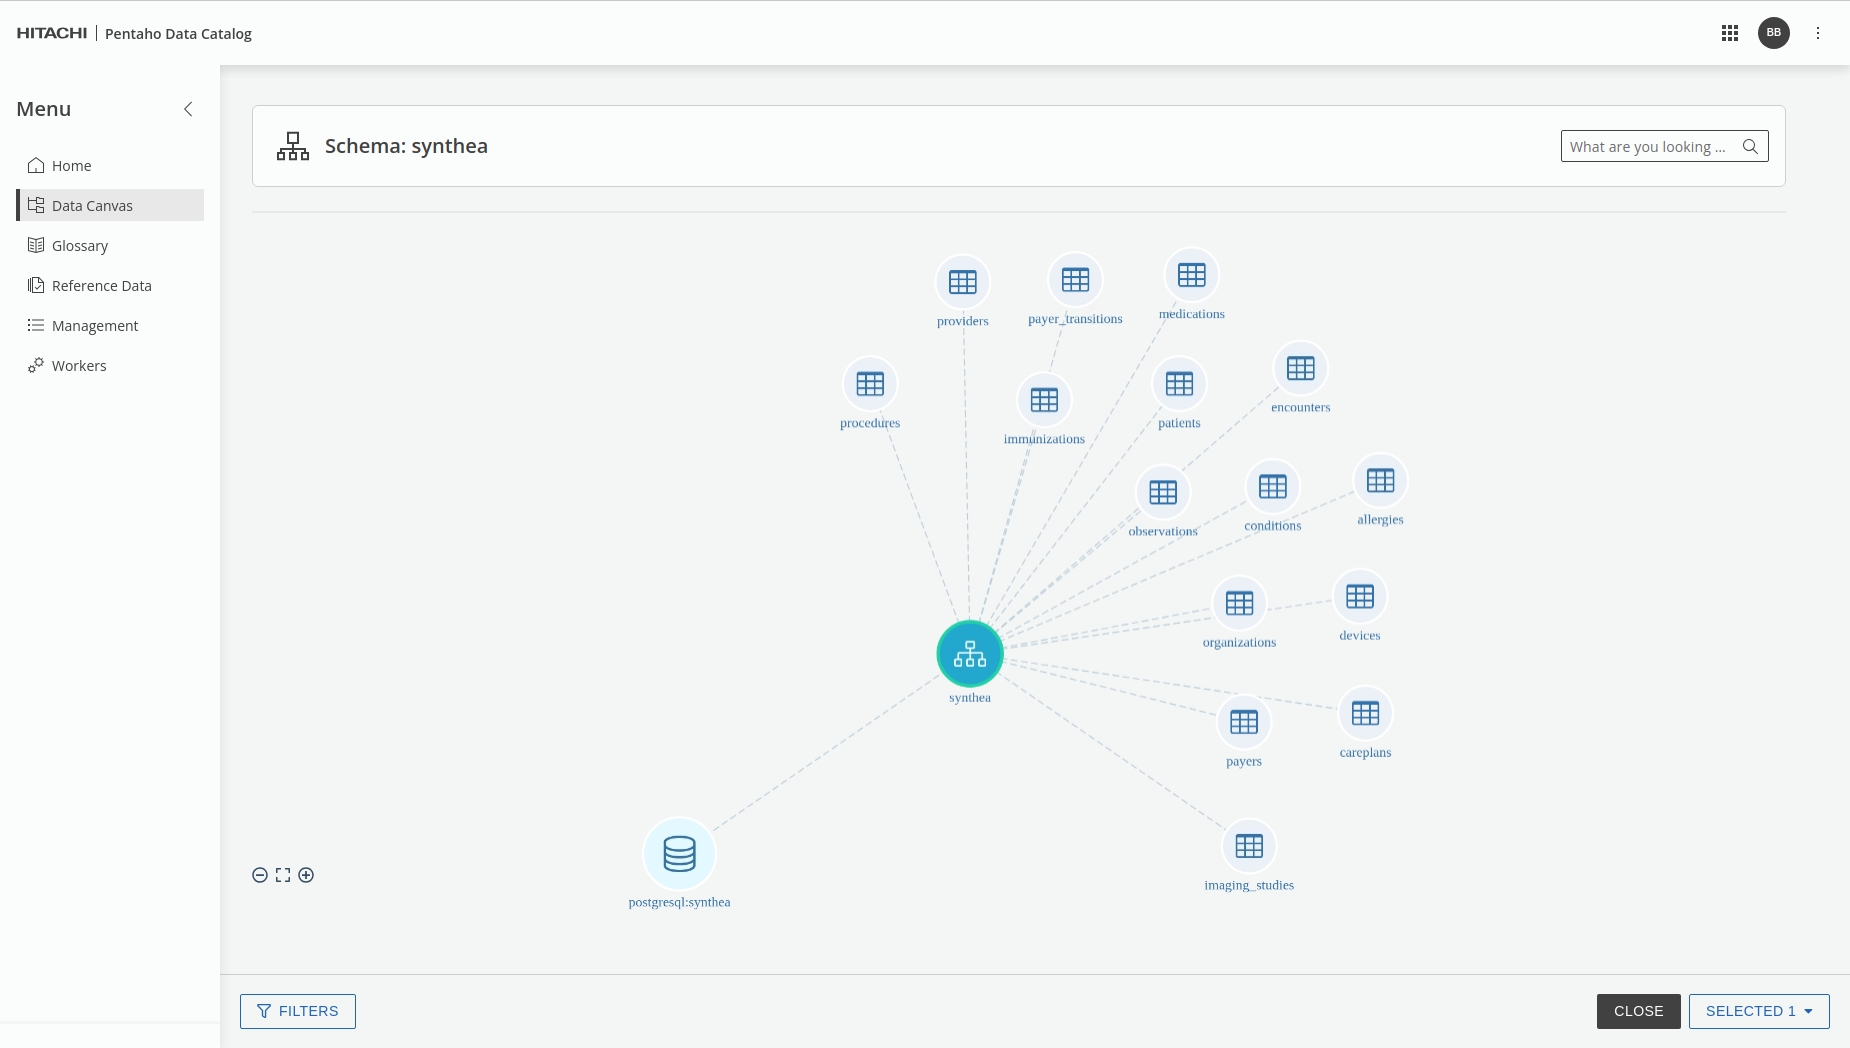
Using Galaxy View for Advanced Data Searches
Galaxy view offers an intuitive approach to navigating complex data structures, empowering users to conduct precise searches across databases. It's an invaluable tool for roles such as information security officers who need to pinpoint sensitive information efficiently, like credit card data within expansive databases.
Key Features:
Search Flexibility: Easily search for terms like "credit" with the ability to filter results. Filters such as Columns allow users to identify specific columns containing credit card information, while the Tables filter returns tables explicitly named with "credit".
Scope Definition: Tailor your search scope using filters to streamline the process of locating pertinent information. This ensures that you only get relevant results matching your search criteria.
Data Visualization: The Galaxy view provides a comprehensive overview, highlighting data relationships at a glance. This bird's eye view is particularly useful for understanding the structure and interconnections of your data beyond what a traditional navigation tree offers.
Drill-Down Capability: Once in the Galaxy view, users can delve deeper into specific data points for detailed information, ensuring a thorough analysis of the data structure and content.
Galaxy view is especially recommended for those who require a macro yet detailed perspective on data relationships, making it easier to manage and analyze vast databases effectively.
To access Galaxy view from the Data Canvas, select, for example 'synthea' folder.
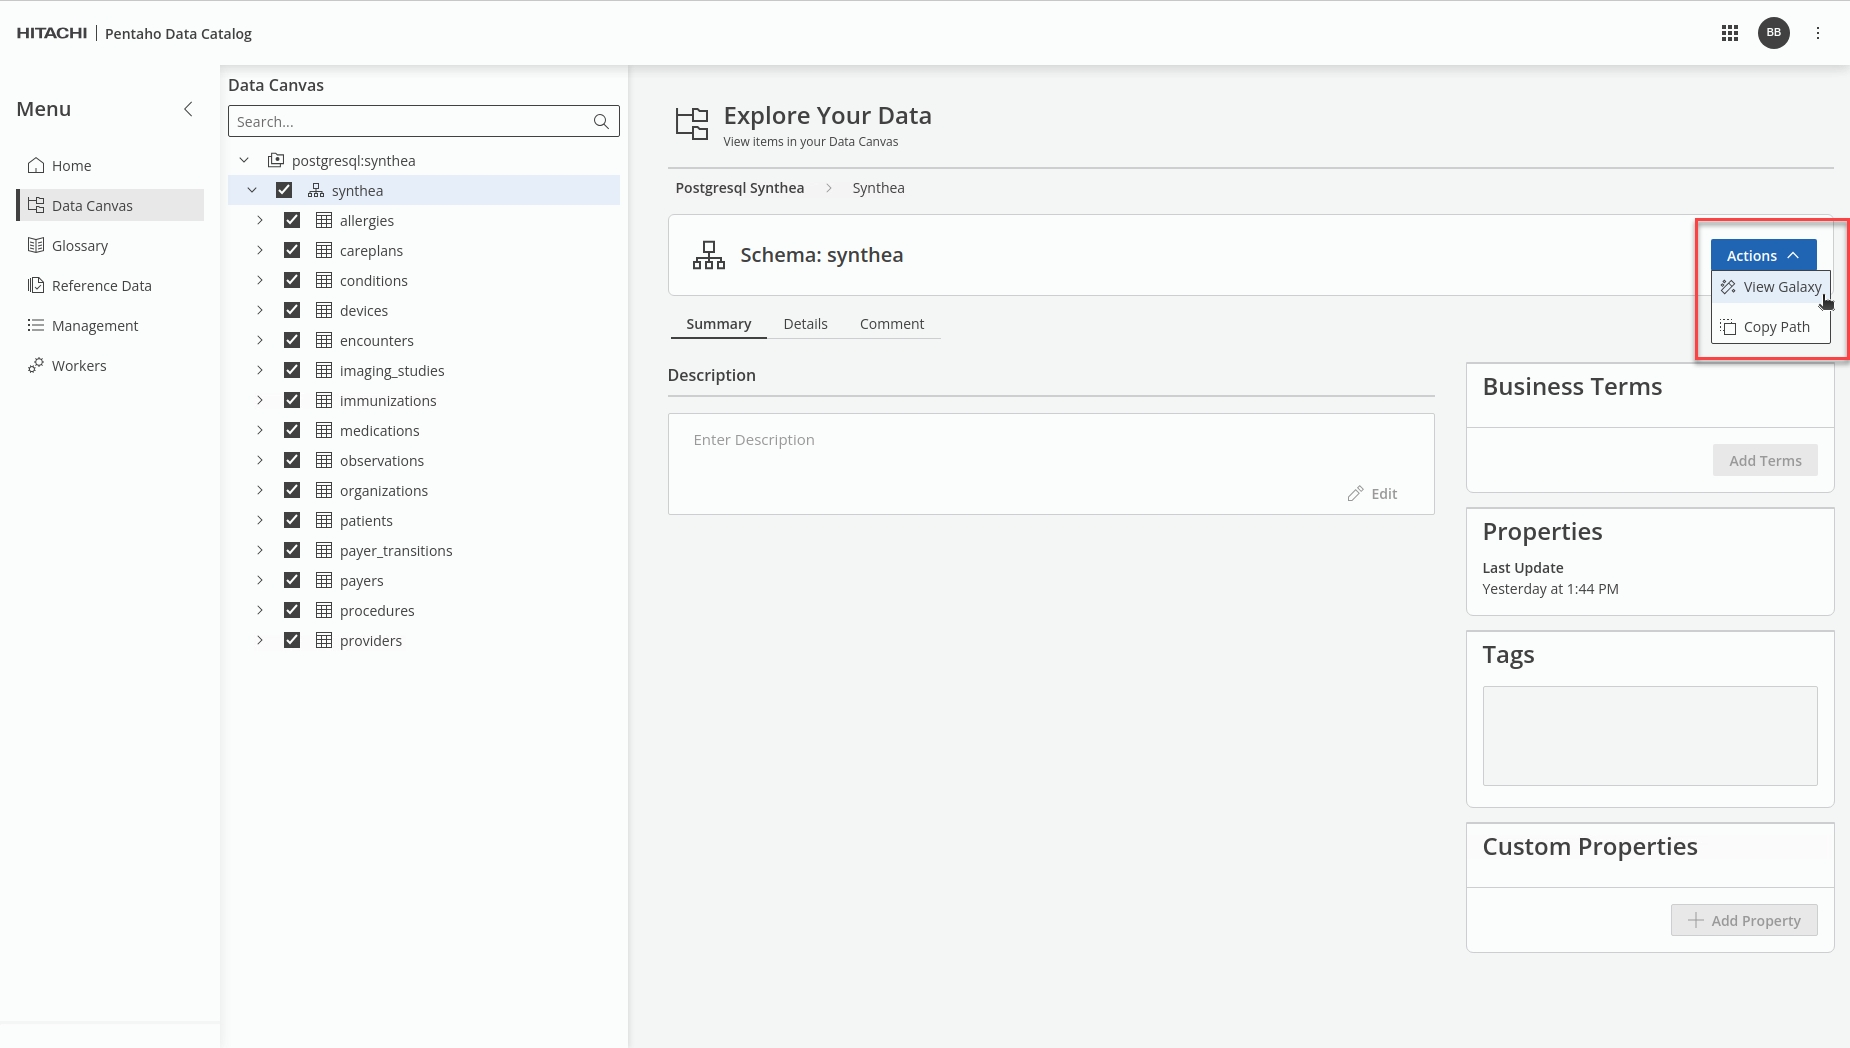
Click 'Actions' and select 'View Galaxy'.
Here are the key tasks you can perform in Galaxy view:
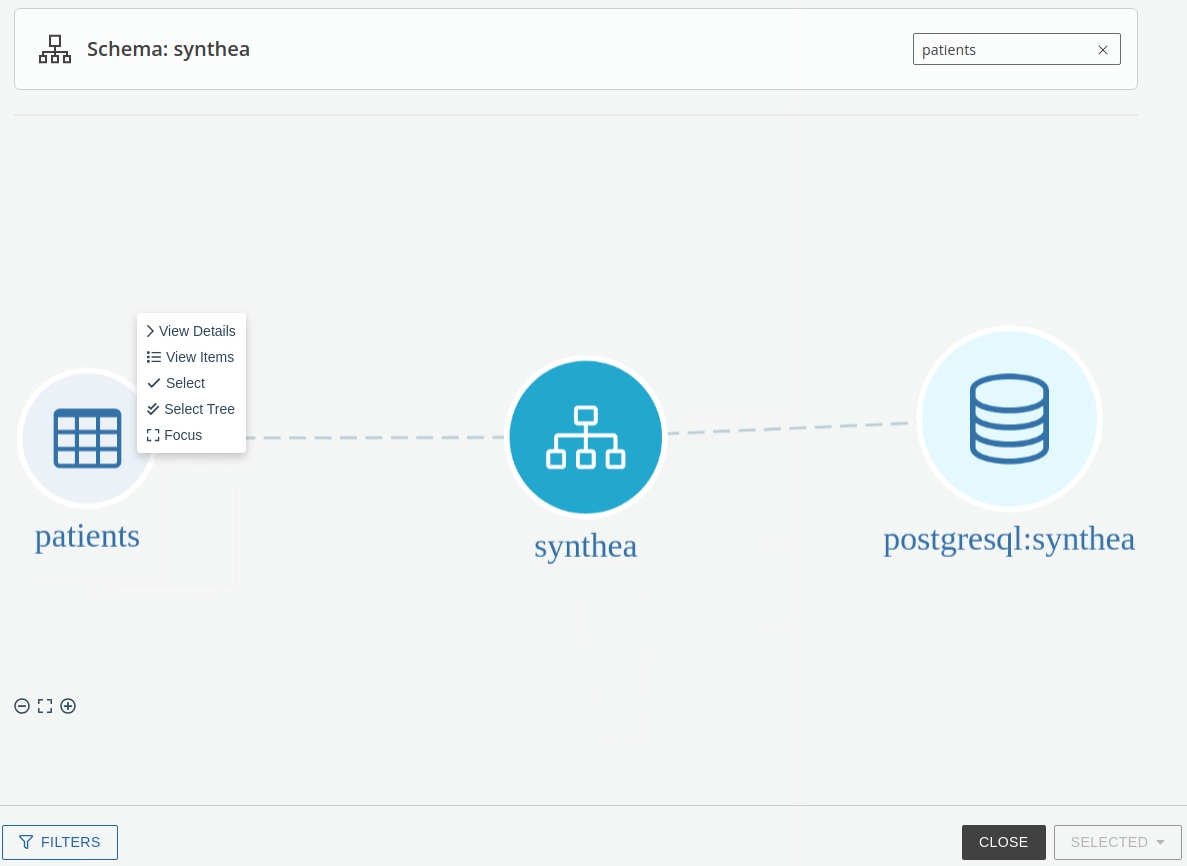
Search
Enter a keyword and select Search to find specific information within the resources. For example, enter "patients" to just show those sources, tables, and columns containing patients information.
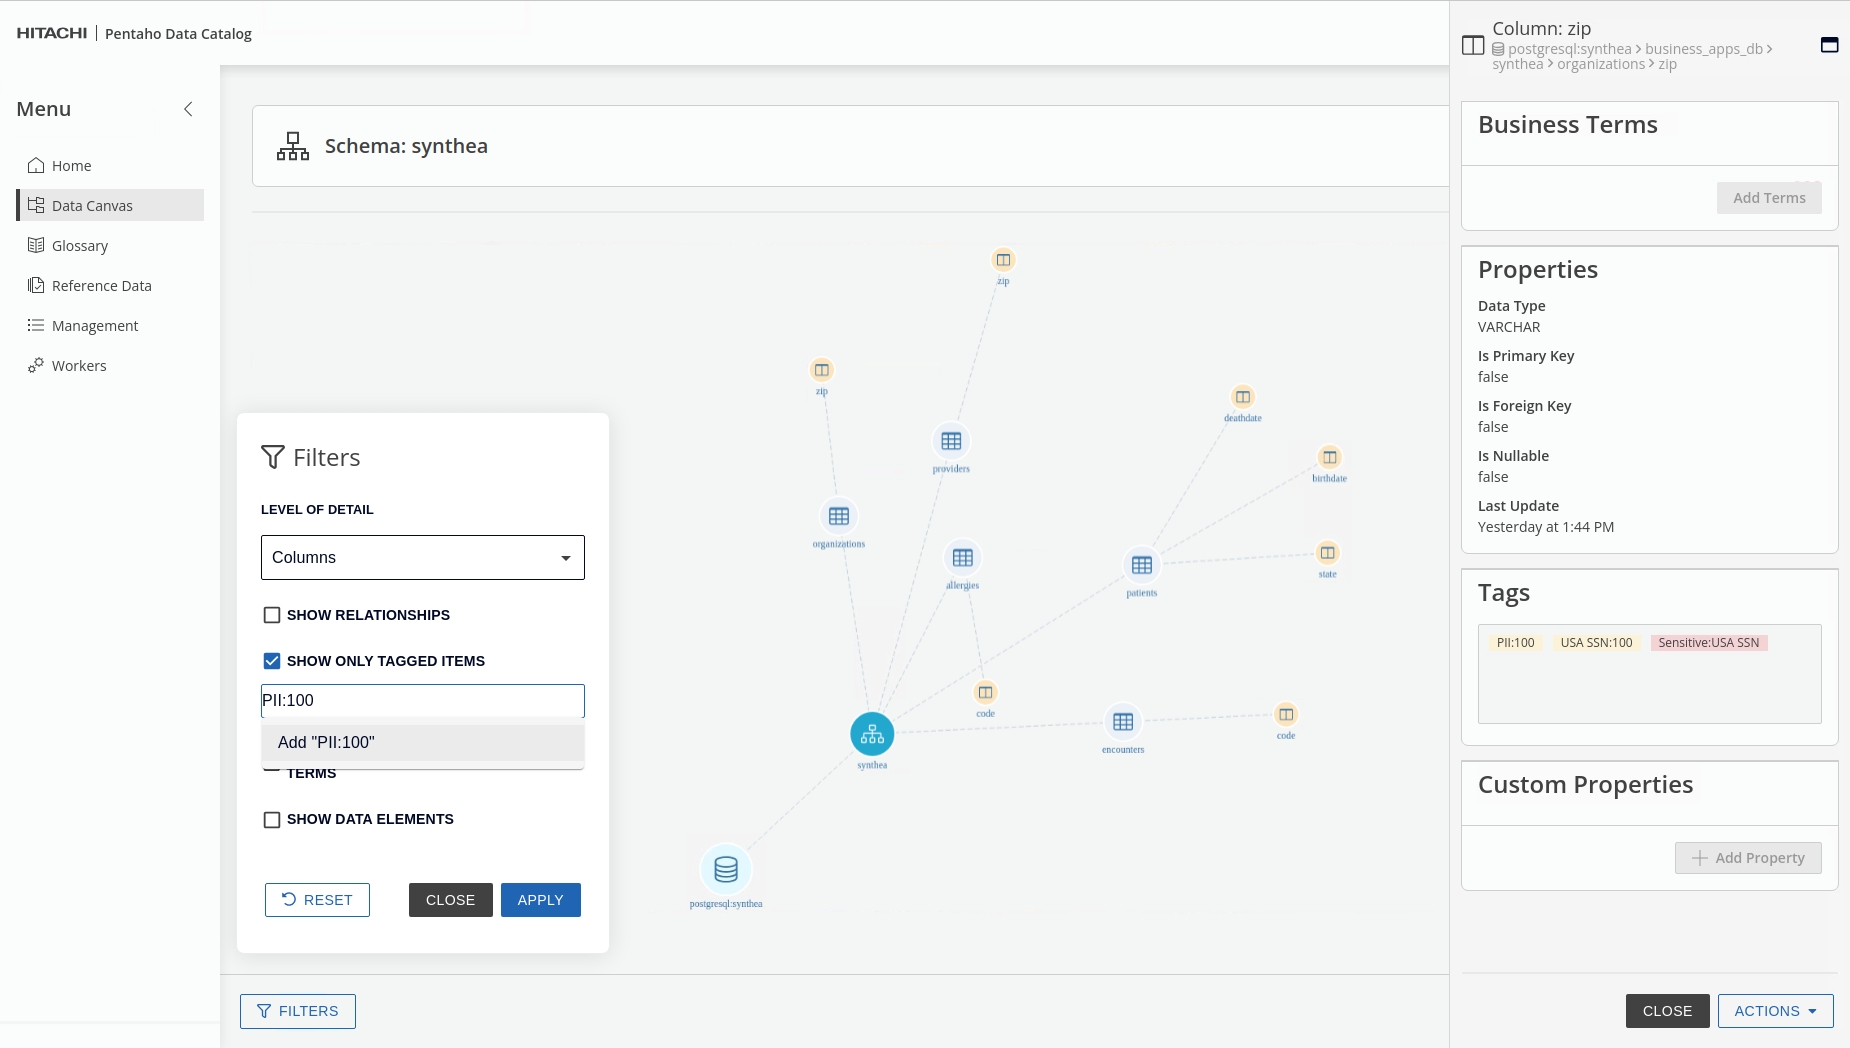
View Details
Right-click on a selected data resource or column in Galaxy view and select View Details. The details panel appears. Depending on your selection, you can view different information, such as properties, tags, and custom properties. Additionally, you can also view and add business terms to the resource.
View Items
Right-click on a data resource in Galaxy view and select View Items. You can view the associated parent and child data assets in a tree view.
Select and Select Tree
To select a single data resource, right-click on a data resource in Galaxy view and click Select. Additionally, you can select associated data resources by clicking Select Tree. When an item is selected, you can right-click and Deselect the item
Focus
Right-click on a selected data resource or table and select Focus. Only the resource and its children appear. Continue to drill down using the Focus option as needed or select Leave Focus to return to the full view.
If you want to reduce the amount of data displayed, you can filter the level of detail in your view by columns or tables.
In Galaxy view, click Filters to open the Filters dialog box and select one or more of the following options:
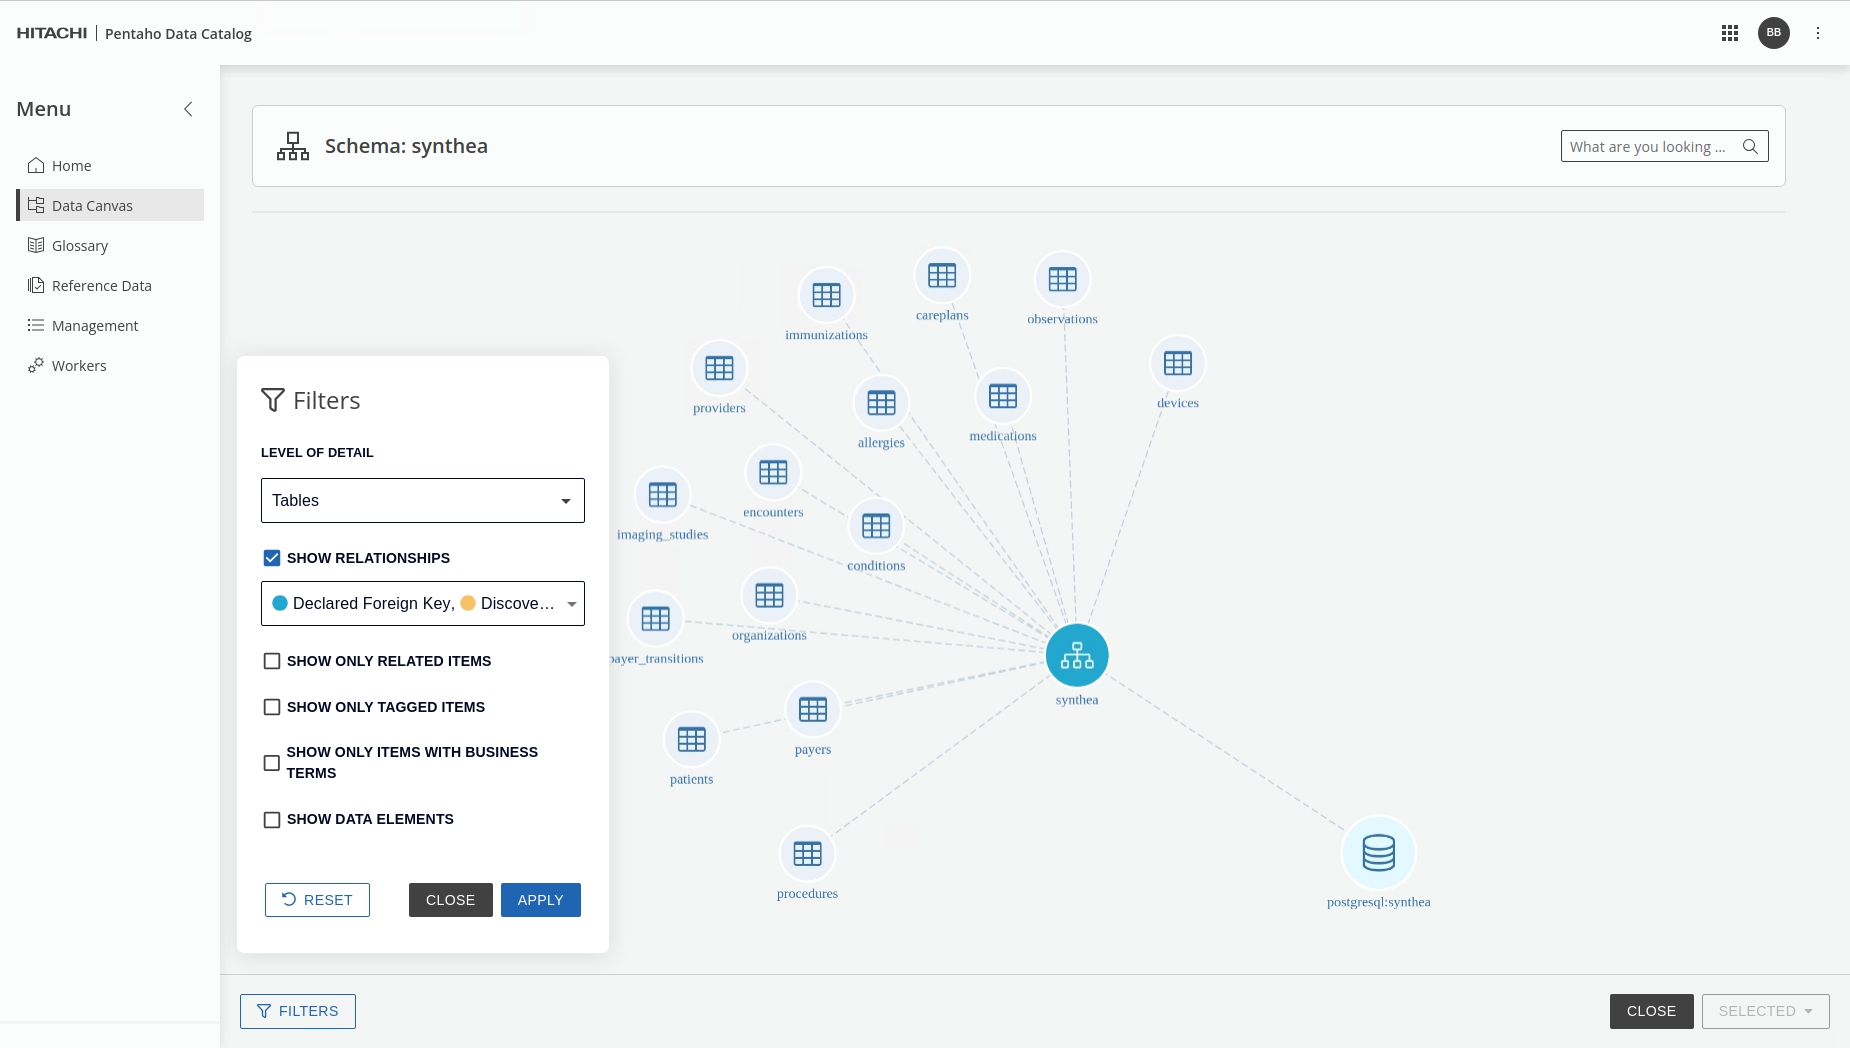
Level of Detail
By default, Galaxy view shows down to the table level as a reduced set of data. Click Columns and apply to have a detailed view down to the column level.
Show Relationships
Helps to limit the results in the view with the data resources that are Declared Foreign Key and Discovered Foreign Key.
Show only Related Items
When the Show Relationships is active, you can choose a threshold number to refine the results further.
Show only Tagged Items
Select this check box to limit the results in the view with the data resources that have associated tags. You can further refine your view by selecting specific tags.
Show only Items with Business Terms
To further limit the results in the view, select this check box. You can further refine your view by selecting specific business terms.
Show Data Elements
You can also choose to show the data elements by selecting this check box.
Reset
Discard your filters.
Last updated
Was this helpful?