Product Performance
Linking dashboard content ..
Workshop - Product Performance
The most powerful dashboards go beyond displaying data - they enable exploration through interactive content linking that connects multiple visualizations into a cohesive analytical experience. In this advanced workshop, you'll master the art of creating interconnected dashboard components where user selections in one panel dynamically filter and update other panels, creating drill-down pathways that reveal deeper insights. This capability transforms static dashboard layouts into interactive exploration tools that let business users navigate from high-level overviews to detailed analyses through simple clicks.
In this hands-on workshop, you'll build a sophisticated three-panel dashboard that demonstrates the full power of content linking by connecting an analysis report, a pie chart, and a bar chart through parameter passing. You'll learn the essential techniques for enabling content linking on specific fields, mapping parameters between components, and creating dynamic titles that reflect user selections. You'll discover how to implement cascading filters where clicking a product name updates a territory sales chart, and clicking a territory segment further refines an order status summary. You'll also master the critical skills of defining default parameter values that ensure dashboards display meaningful data even before user interaction, and creating query conditions that respond to parameter changes in real-time.
What You'll Accomplish:
Select and configure the 1 and 2 dashboard layout template with Ruby theme
Set dashboard properties including page title (Product Performance Dashboard)
Add the Product Sales by Year analysis report to the primary panel with a custom title (Product Sales Analysis)
Enable content linking on the Product field to allow user selections to drive other components
Create a pie chart component by building a metadata query against the Orders data source
Implement parameterized filtering by adding a Product Name condition using the {PRODUCT} parameter with a default value
Configure the pie chart to display Territory sales totals with appropriate chart properties
Add dynamic parameter references to panel titles to show current selections
Map parameters between components by linking the chart's PRODUCT parameter to the analysis report's Product output
Enable content linking on the Territory field in the pie chart to drive downstream filtering
Build a bar chart showing order status distribution using COUNT_DISTINCT aggregation on Order Number
Implement multi-parameter filtering with both {PRODUCT} and {TERRITORY} parameters with appropriate defaults
Create cascading parameter mappings where the bar chart receives PRODUCT from the analysis report and TERRITORY from the pie chart
Test the complete interactive experience by clicking through product selections and territory segments
By the end of this workshop, you'll have created a fully interactive dashboard that demonstrates advanced content linking techniques essential for building self-service analytical experiences. You'll understand how to design parameter flows that connect multiple components, how to implement cascading filters that progressively narrow analytical focus, and how to create intuitive user experiences where the path to insight is guided by simple point-and-click interactions.
You'll have mastered the techniques for defining default parameter values that ensure graceful behavior, creating dynamic titles that provide context, and mapping parameters across heterogeneous component types. These skills represent the pinnacle of dashboard design, enabling you to build analytical applications that empower business users to explore data relationships independently and discover insights through guided, interactive investigation.
Prerequisites: Pentaho Business Analytics Server with Orders data source, Steel Wheels Widget Library containing Product Sales by Year analysis report Estimated Time: 40-45 minutes
Dashboard Templates
Creating a dashboard in Dashboard Designer is as simple as choosing a layout template, theme, and the content you want to display.
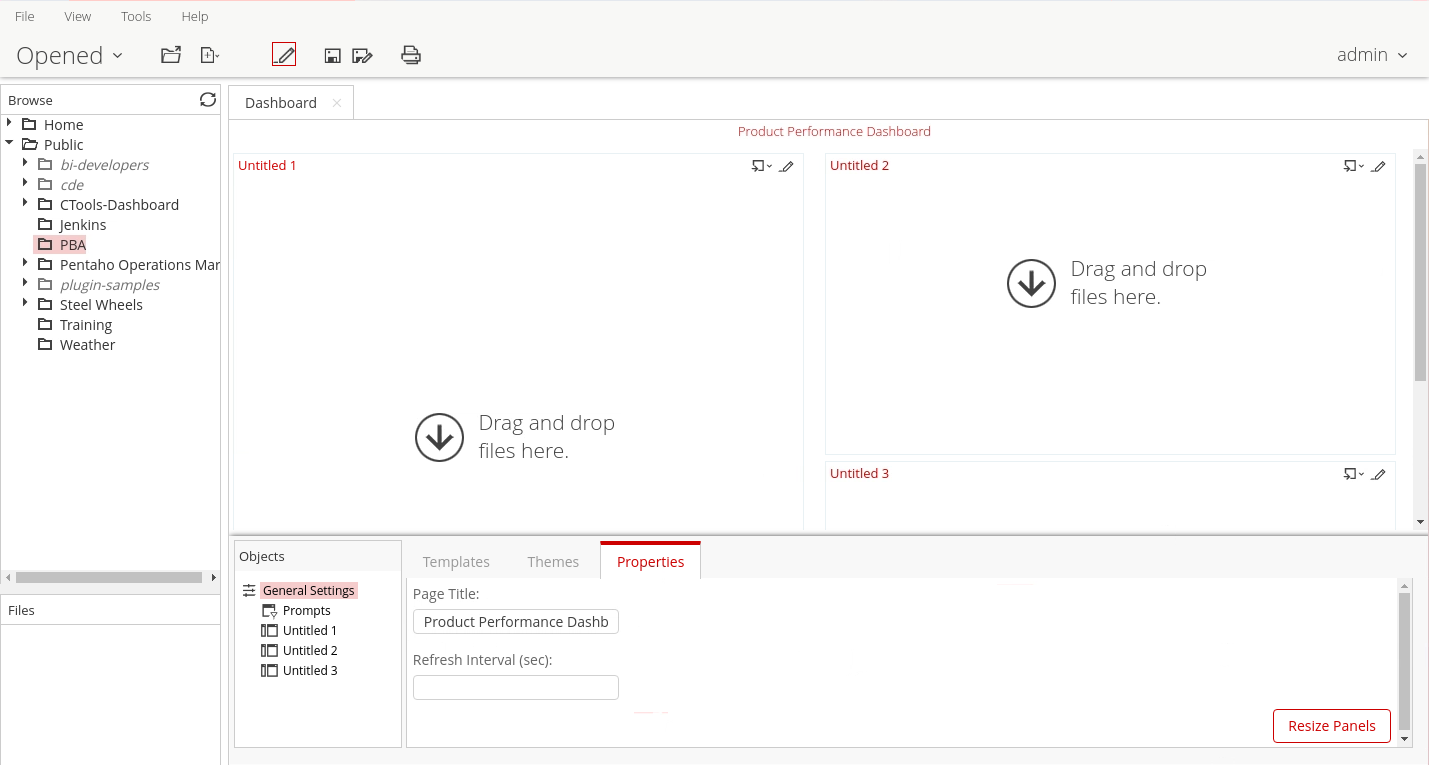
From the User Console Home Perspective, click Create New -> Dashboard.
Select the 1 and 2 template, on the Templates tab, click 1 and 2.
To view the available themes, click the Themes tab.
Select: Ruby theme.
In the Page Title text box, type: Product Performance Dashboard.
Product Sales by Year
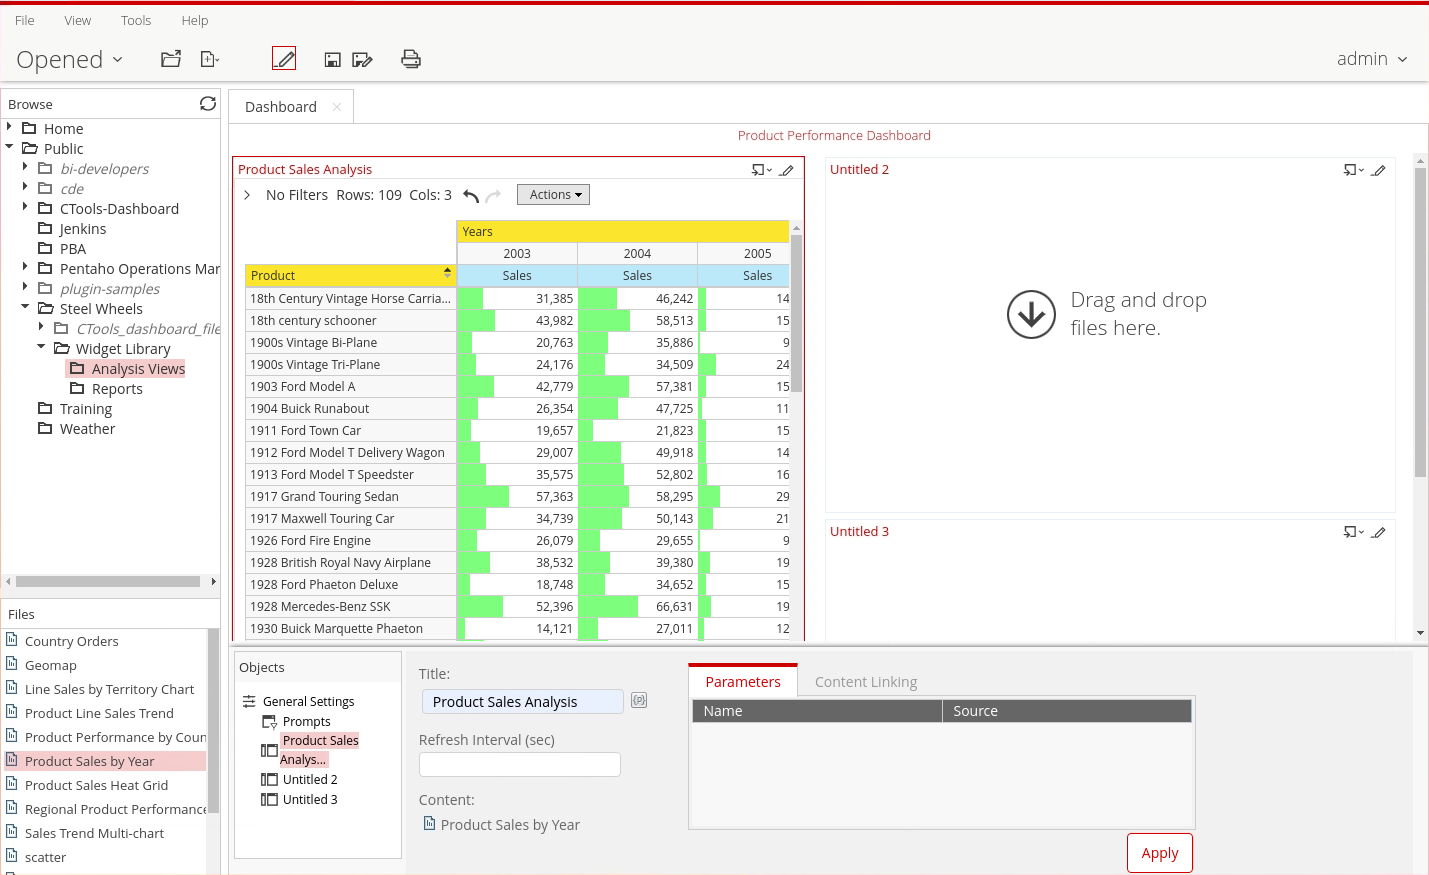
To add the Product Sales by Year report to the dashboard, from the Browse pane:
Expand the Steel Wheels -> Widget Library -> Analysis Views folder.
From the Files pane, drag: 'Product Sales by Year' to the Untitled 1 panel on the dashboard.
To add a panel title, in the Title text box, type: 'Product Sales Analysis'.
To enable dashboard viewers to click a Product Name in the report and have the chart on the right update with the values associated with that product, you must enable content linking.
To enable content linking for the Product Name field:
• In the bottom pane, click the Content Linking tab.
• Click the Enabled checkbox for Product.
• Click Apply.

Territory Sales Mix
To allow dashboard users click a 'Product Name' in the report and have the chart on the right update with the values associated with that product, enable content linking.
In the Untitled 2 header, click Insert Content, and then click Chart.
From the Select Data Source dialog, click Orders, and then click OK.
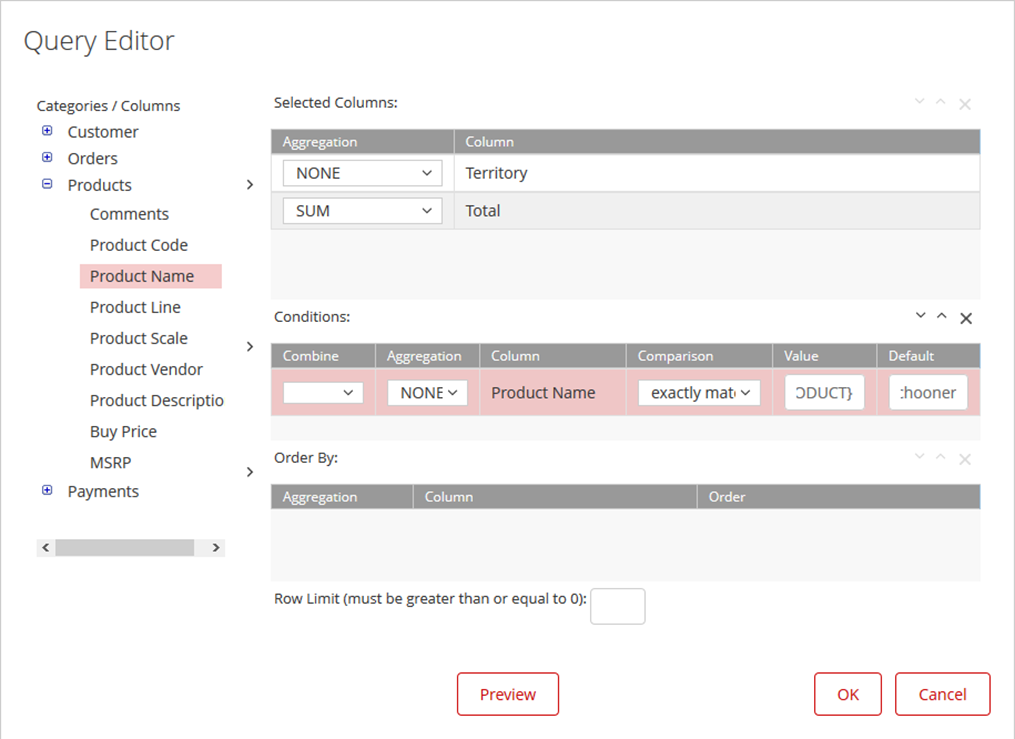
Add columns to the Selected Columns:
• From the Categories/Columns click Customer > Territory.
• Click the top arrow to move Territory to the Selected Columns area.
• From the Categories/Columns click Orders -> Total.
• Click the top arrow to move Total to the Selected Columns area.
Add a condition for Product Name:
• From the Categories / Columns list, click Products > Product Name.
• Click the middle arrow to move Product Name to the Conditions area.
• In the Value field, type {PRODUCT}.
• In the Default field, type: 18th century schooner.
• Click OK.
To create the pie chart, complete the following fields in the Chart Designer window, and then click OK.
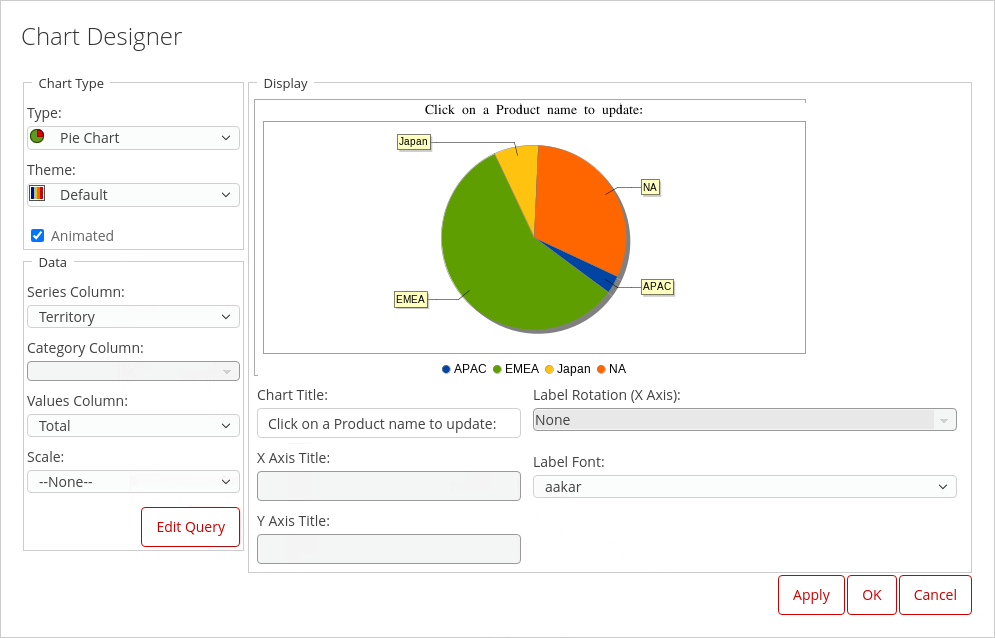
Chart Type
Pie Chart
Theme
Legacy
Series Column
Territory
Values Column
Total
Chart Title
Click on a Product Name to update:
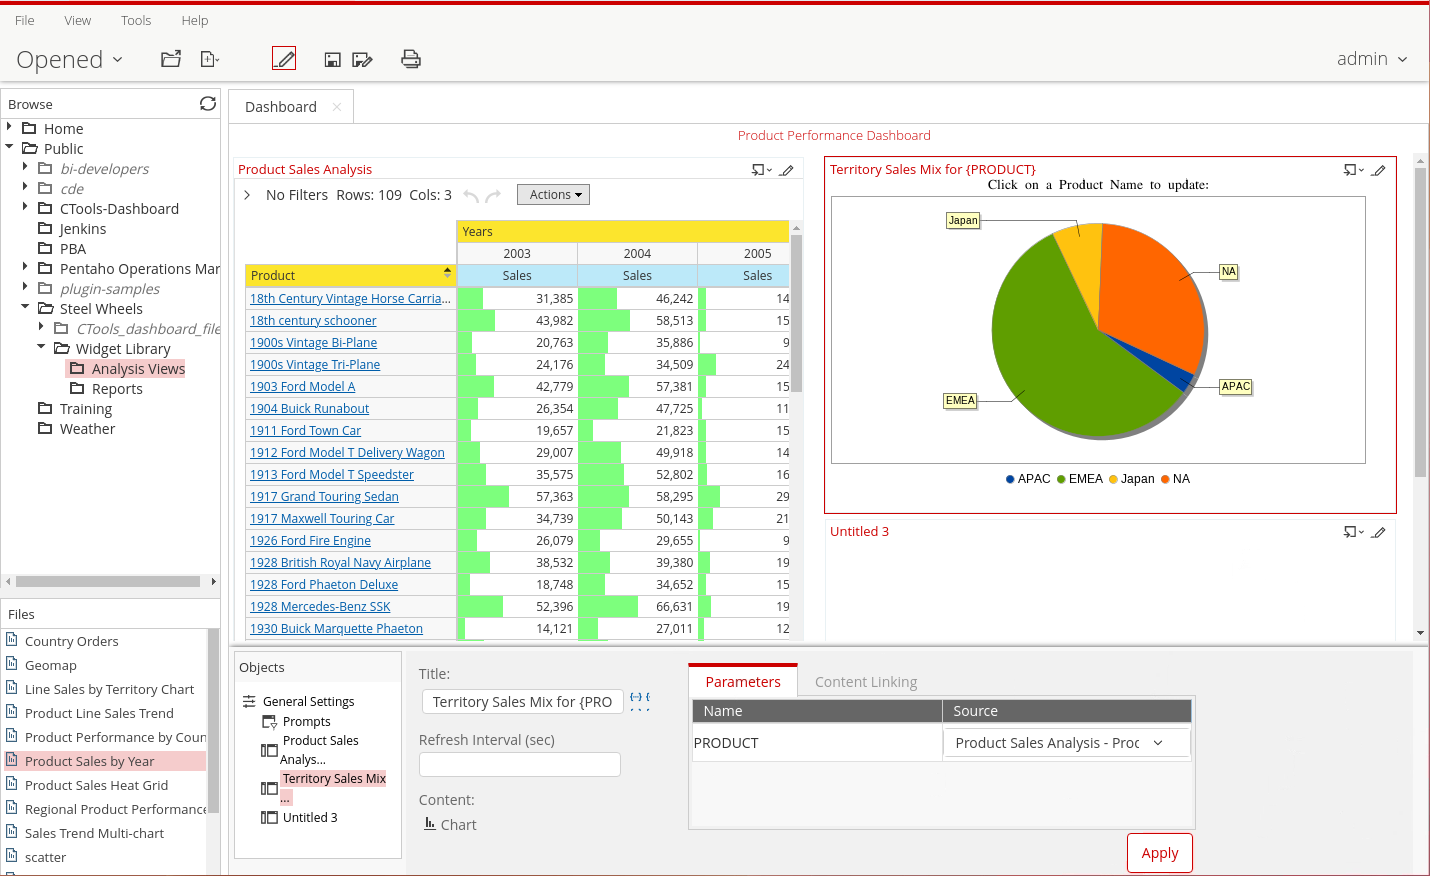
To add a panel title with the parameter, in the Title text box, type Territory Sales Mix for, and then click the Add parameters to title icon.

To create a parameter that obtains the Product Name from the Product Sales Analysis report:
• In the bottom pane, click the Parameters tab.
• From the Source drop-down list, select Product Sales Analysis – Product.
To enable content linking for the Territory field:
• In the bottom pane, click the Content Linking tab.
• Click the Enabled checkbox for Territory.
• Click Apply.
Bar Chart
Finally .. create a bar chart showing the number of orders for the product selected on the Product Sales by Year report and the Territory.
In the Untitled 3 header, click Insert Content, and then click Chart.
From the Select Data Source dialog, click Orders, and then click OK.
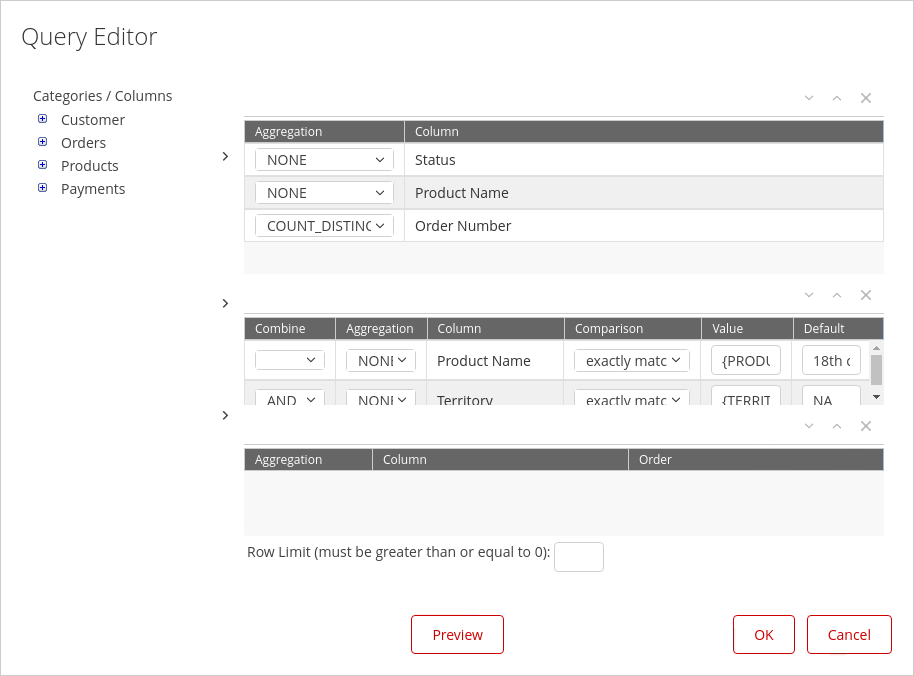
Add columns to the Selected Columns:
• From the Categories / Columns click Orders -> Status.
• Click the top arrow to move Status to the Selected Columns area.
• From the Categories / Columns click Products > Product Name.
• Click the top arrow to move Product Name to the Selected Columns area.
• From the Categories/Columns click Orders > Order Number.
• Click the top arrow to move Order Number to the Selected Columns area.
To count the number of distinct orders, from the Aggregation drop-down list for Order Number, select COUNT_DISTINCT.
Add conditions for Product Name and Territory:
• From the Categories / Columns list, click Products -> Product Name.
• Click the middle arrow to move Product Name to the Conditions area.
• In the Value field, type {PRODUCT}.
• In the Default field, type 18th century schooner.
• From the Categories/Columns list, click Customer ->Territory.
• Click the middle arrow to move Territory to the Conditions area.
• In the Value field, type {TERRITORY}.
• In the Default field, type NA.
• Click OK.
Complete the following fields in the Chart Designer window, and then click OK.
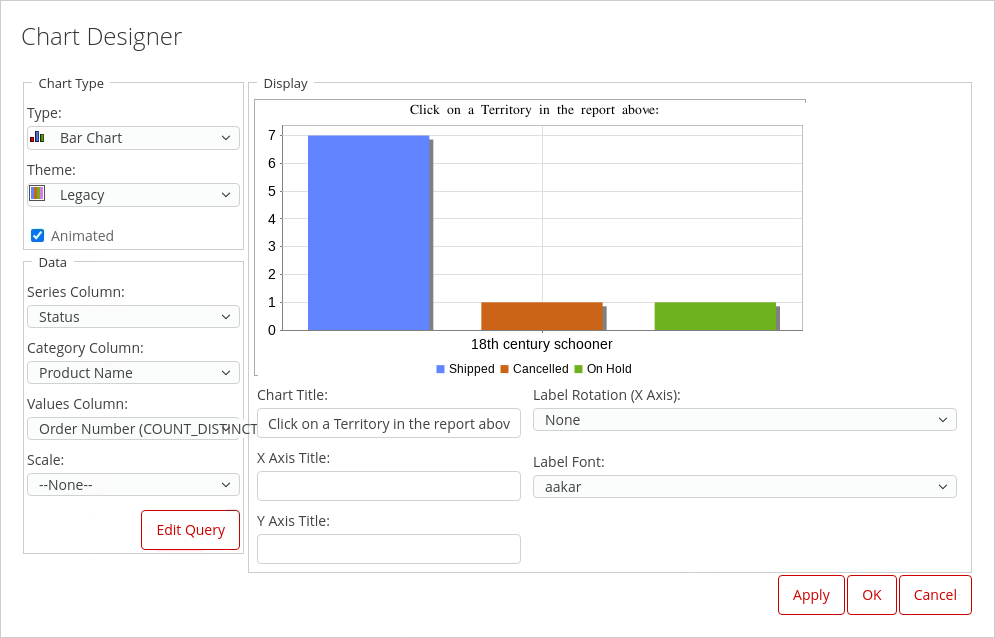
Chart Type
Bar Chart
Theme
Legacy
Series Column
Status
Category Column
Product Name
Values Column
Order Number (COUNT_DISTINCT)
Chart Title
Click on a Territory in the report above:
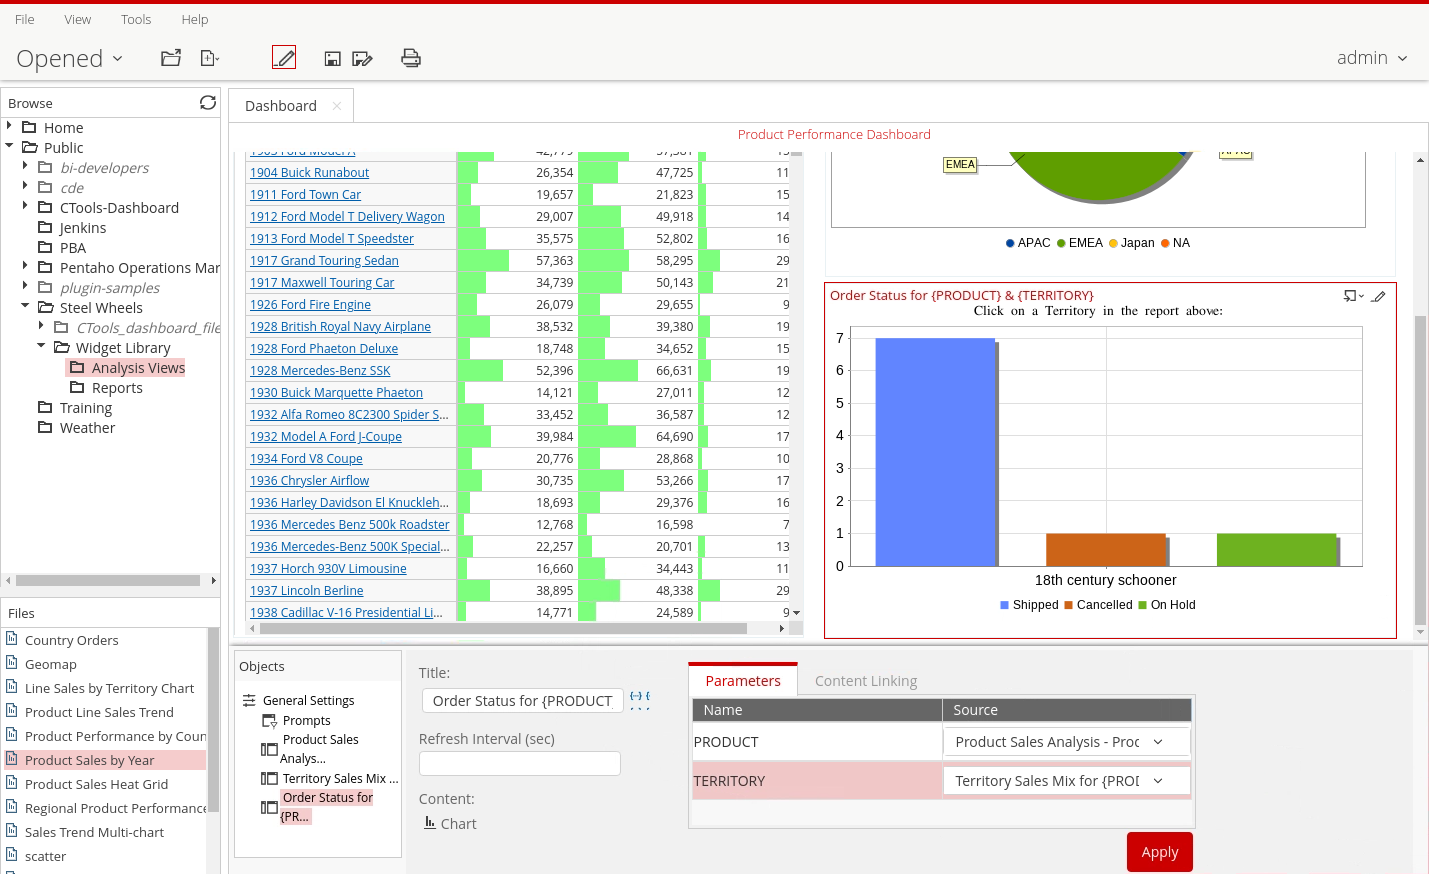
In the Title text box, type Order Status Summary for, and then click the Add parameters to title icon.
To create parameters that obtain the Product Name from the Product Sales Analysis report and the Territory from the Territory Sales Mix chart:
• In the bottom pane, click the Parameters tab.
• From the Source drop-down list for PRODUCT, select Product Sales Analysis – Product.
• In the bottom pane, click the Parameters tab.
• From the Source drop-down list for TERRITORY, select Territory Sales Mix.
• Click Apply.
The Content Linking will only work once you have saved your dashboard.
On the main toolbar, click the Edit Content button.
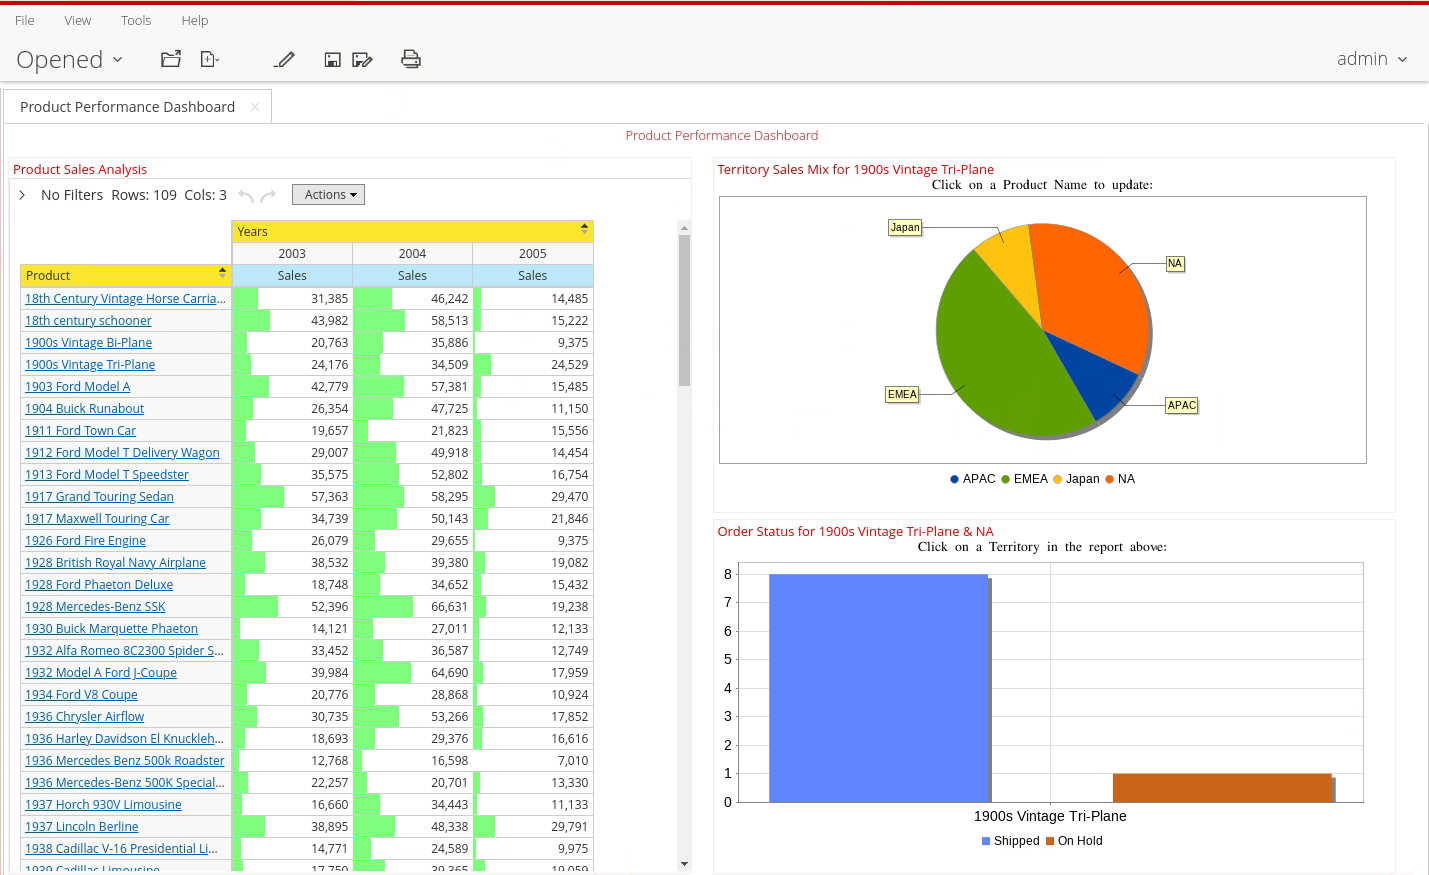
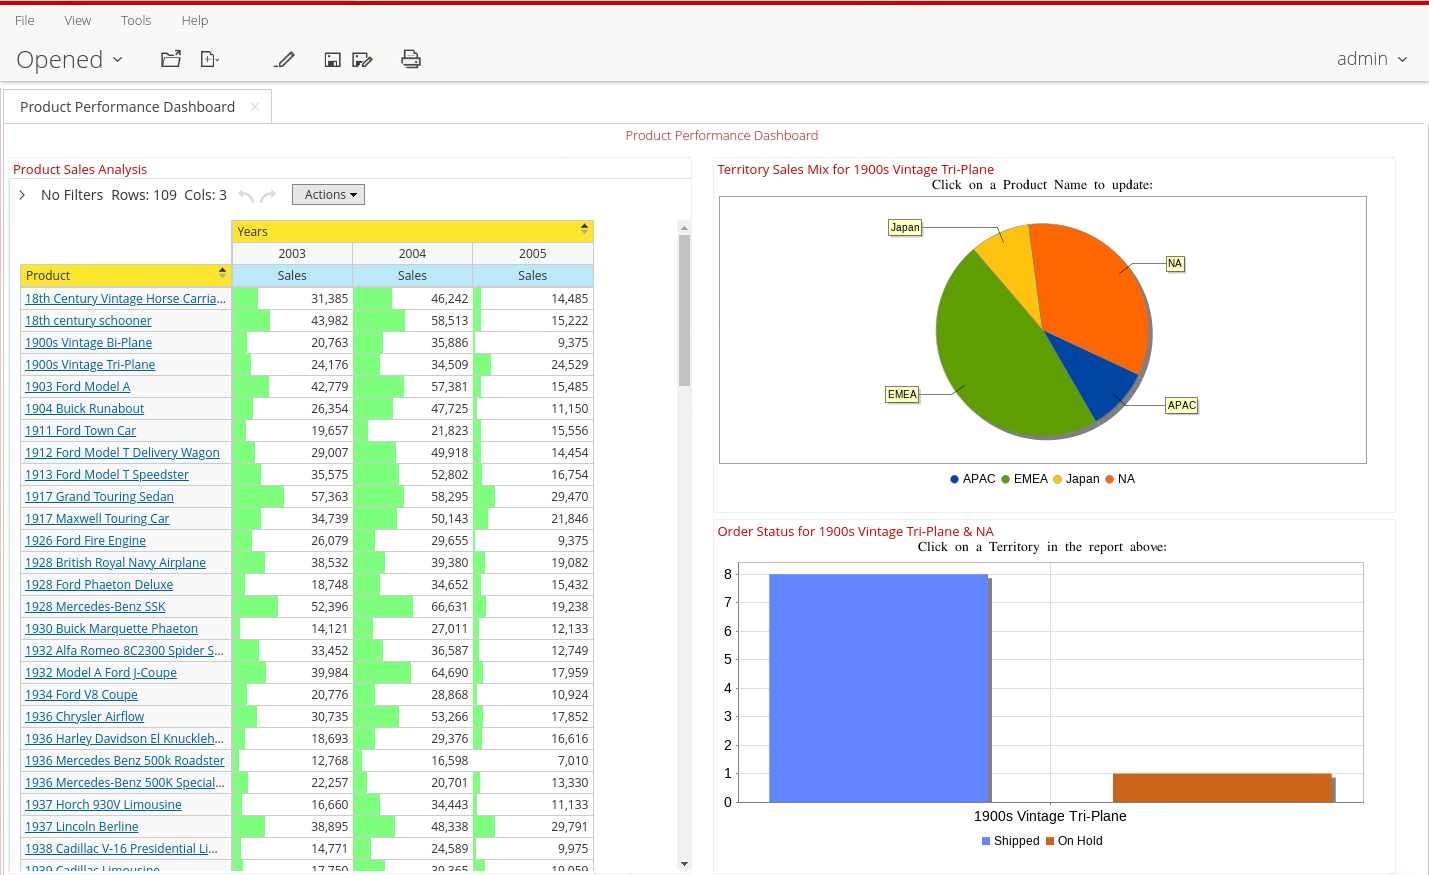
From the Product Sales Analysis report, click 1900s Vintage Tri-Plane.
From the Territory Sales Mix chart, click NA.
Last updated
Was this helpful?
