> For the complete documentation index, see [llms.txt](https://academy.pentaho.com/llms.txt). Markdown versions of documentation pages are available by appending `.md` to page URLs; this page is available as [Markdown](https://academy.pentaho.com/pentaho-business-analytics/business-analytics/dashboard-designer/inventory.md).
# Inventory
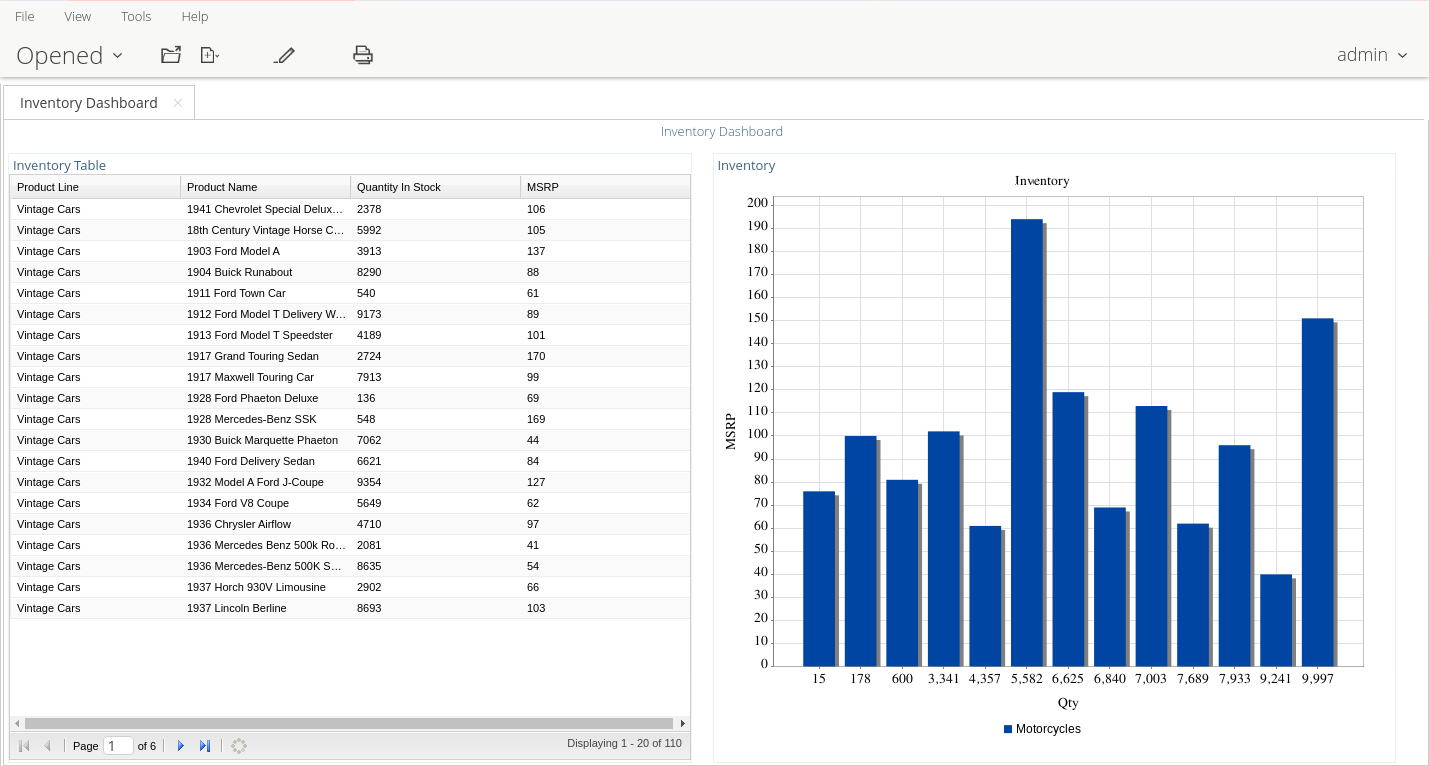
Create dashboard content ..
{% hint style="warning" %}
#### Workshop - Inventory
While report-based dashboards excel at combining existing reports, query-based dashboards offer a different approach that provides maximum flexibility and control over your data visualization. In this workshop, you'll learn to build dashboards from the ground up using Dashboard Designer's integrated query tools, creating custom data tables and charts without the need for pre-existing reports. This approach is ideal when you need specific data views that don't already exist in your reporting environment or when you want to rapidly prototype dashboard content directly from your data sources.
In this hands-on workshop, you'll experience the query-based dashboard development workflow, learning to connect directly to data sources and build visualizations through the visual query designer. You'll discover how to construct metadata queries that select, filter, and sort data to meet specific business requirements, then transform those queries into both tabular and graphical components. You'll master the essential techniques for creating data tables that display detailed inventory information and charts that visualize relationships between key metrics. This approach gives you complete control over every aspect of your dashboard content, from the SQL logic that retrieves the data to the final presentation of charts and tables.
**What You'll Accomplish:**
* Select and configure dashboard layout templates (2 Column) and themes (Crystal) for visual presentation
* Set dashboard properties including title (Inventory Dashboard)
* Connect to the Inventory data source using the metadata layer
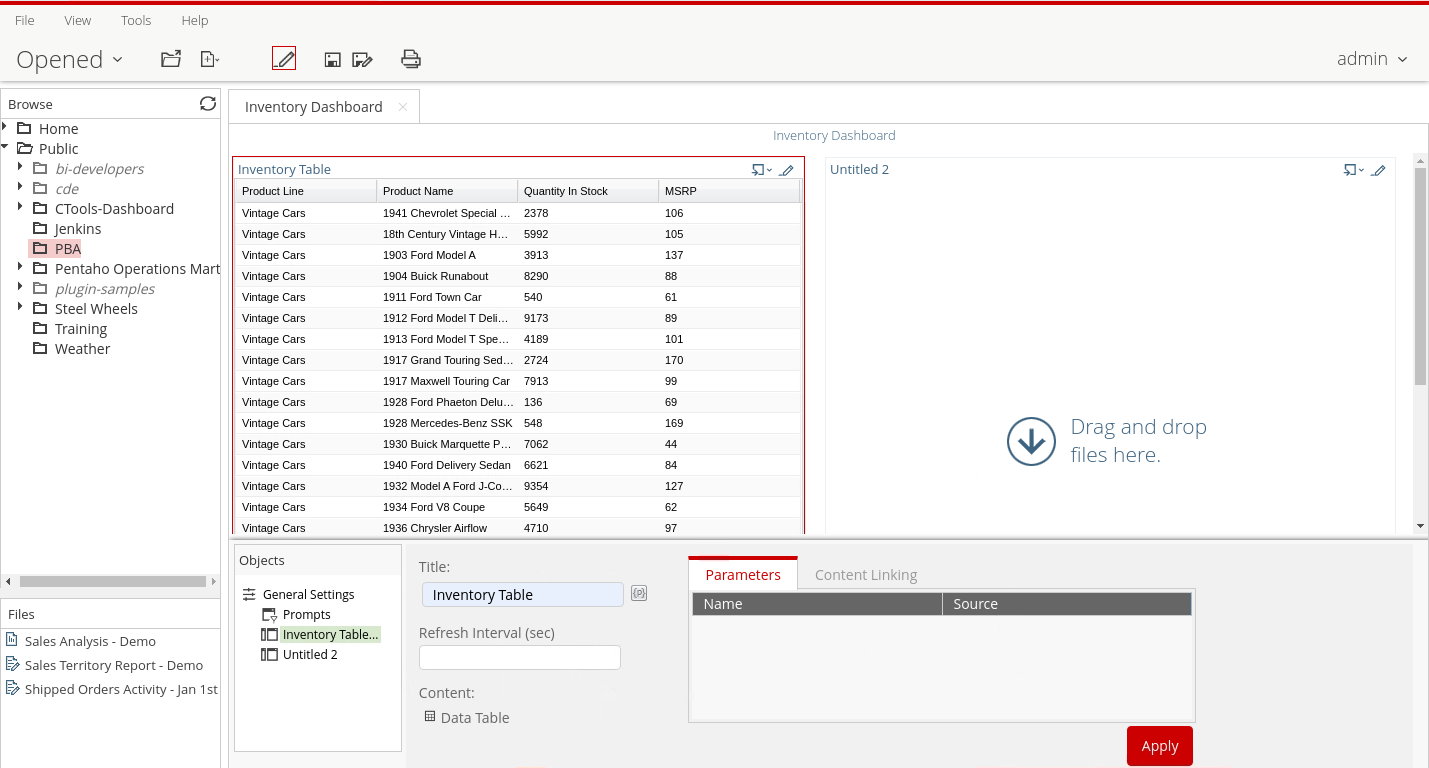
* Build a data table component by constructing a metadata query that selects Product Line, Product Name, Quantity in Stock, and MSRP
* Apply sorting (ascending by Product Line) to organize tabular data logically
* Configure data table properties and apply custom titles (Inventory Table)
* Create a chart component using the same Inventory data source with a new query
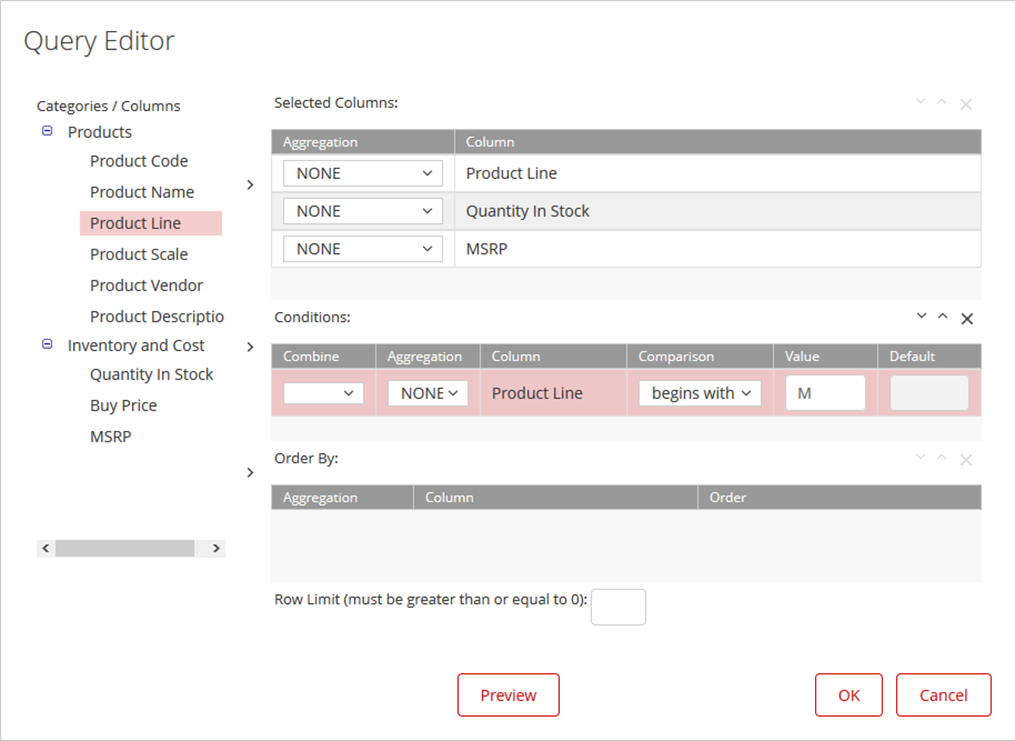
* Implement query filters by adding conditions (Product Line begins with "M") to focus on specific data subsets
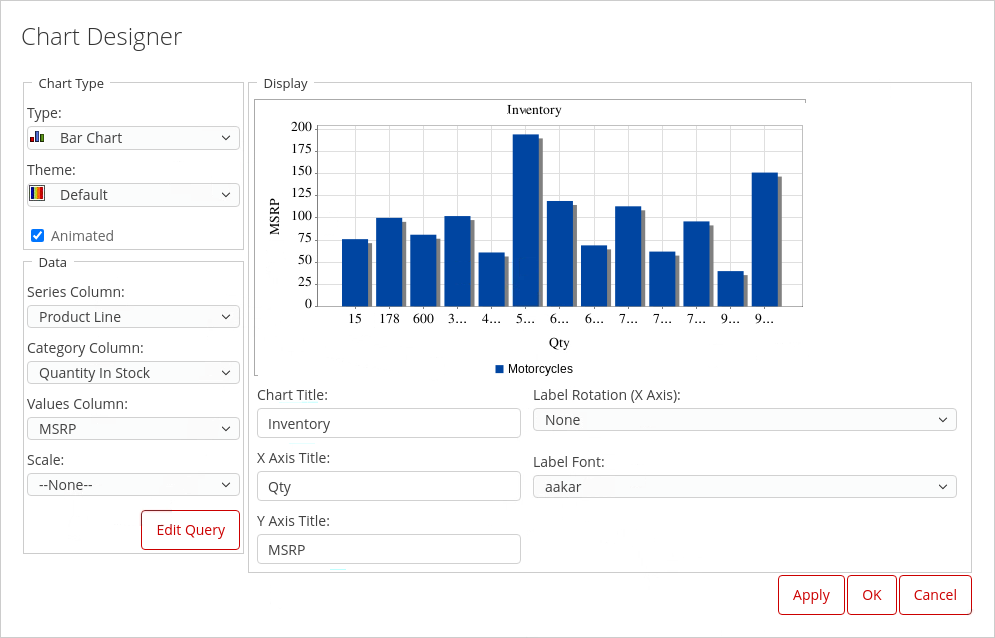
* Design a chart using the Chart Designer by mapping columns to chart elements (Series, Category, Values)
* Configure chart properties including chart title, axis labels, and visual presentation
By the end of this workshop, you'll have created a functional query-based dashboard that demonstrates the power and flexibility of building content directly from data sources. You'll understand when to choose query-based dashboards over report-based approaches, recognizing that this pattern excels when you need custom visualizations, rapid prototyping capabilities, or specific data views that don't warrant creating full reports. You'll have gained experience with the metadata query designer, understanding how to select columns, apply conditions, and transform query results into meaningful visualizations.
**Prerequisites:** Pentaho Business Analytics Server with Inventory metadata data source configured\
**Estimated Time:** 25-30 minutes
{% endhint %}
Inventory Dashboard
{% tabs %}
{% tab title="Template & Data Source" %}
{% hint style="info" %}
#### Dashboard Templates
Creating a dashboard in Dashboard Designer is as simple as choosing a layout template, theme, and the content you want to display.
{% endhint %}
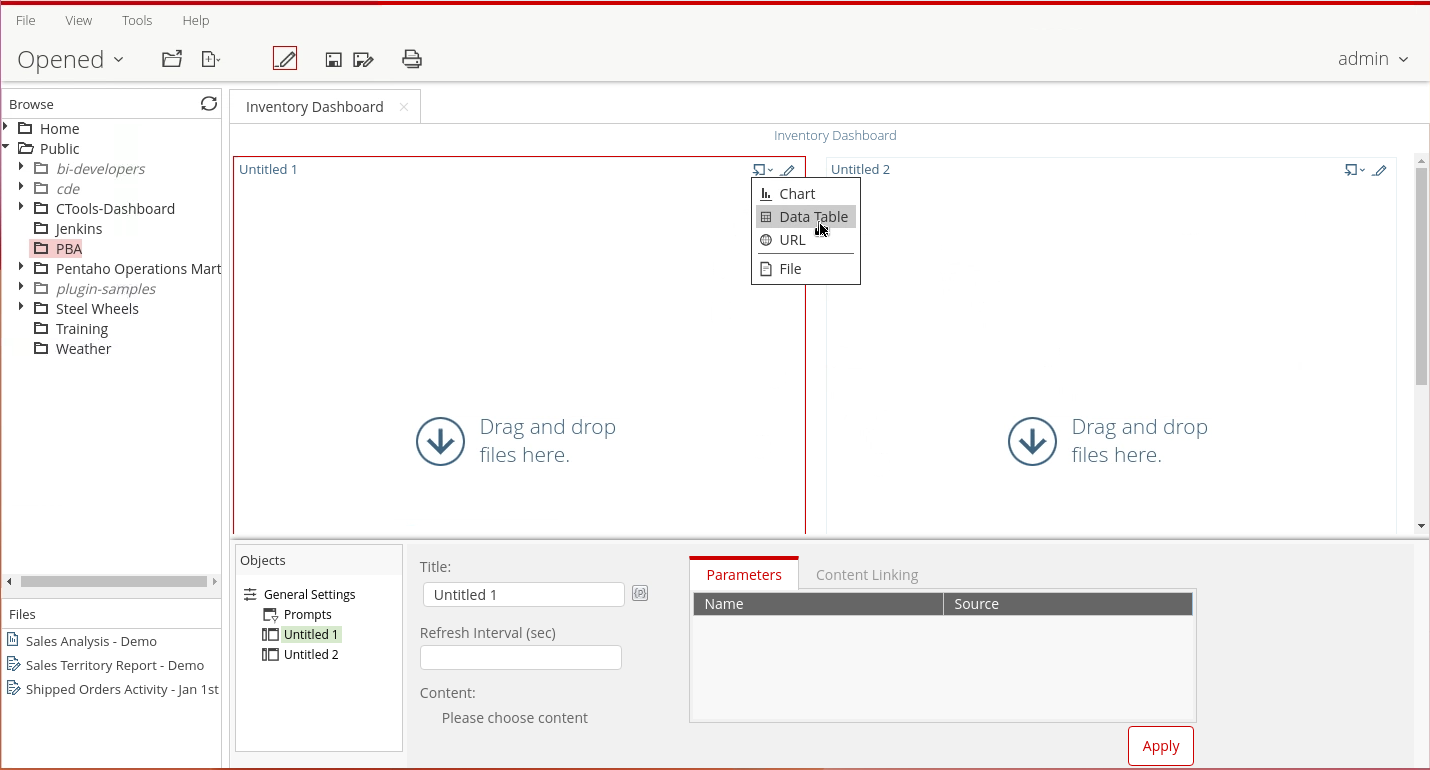
Template - 2 column
1. From the User Console Home Perspective, click Create New -> Dashboard.
2. On the Templates tab, click 2 Column.
3. On the Themes tab, select Crystal.
4. Click the Properties tab, and Enter: Inventory Dashboard as the title.
5. In the Untitled 1 header, click Insert Content, and then click Data Table.
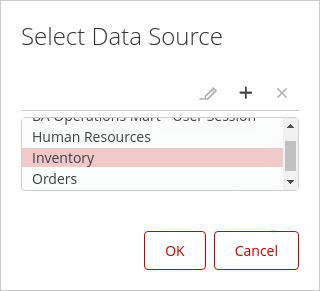
6. From the Select Data Source dialog, click Inventory, and then click OK.
Inventory - data source
{% endtab %}
{% tab title="Content" %}
#### Data Table
Product Queries
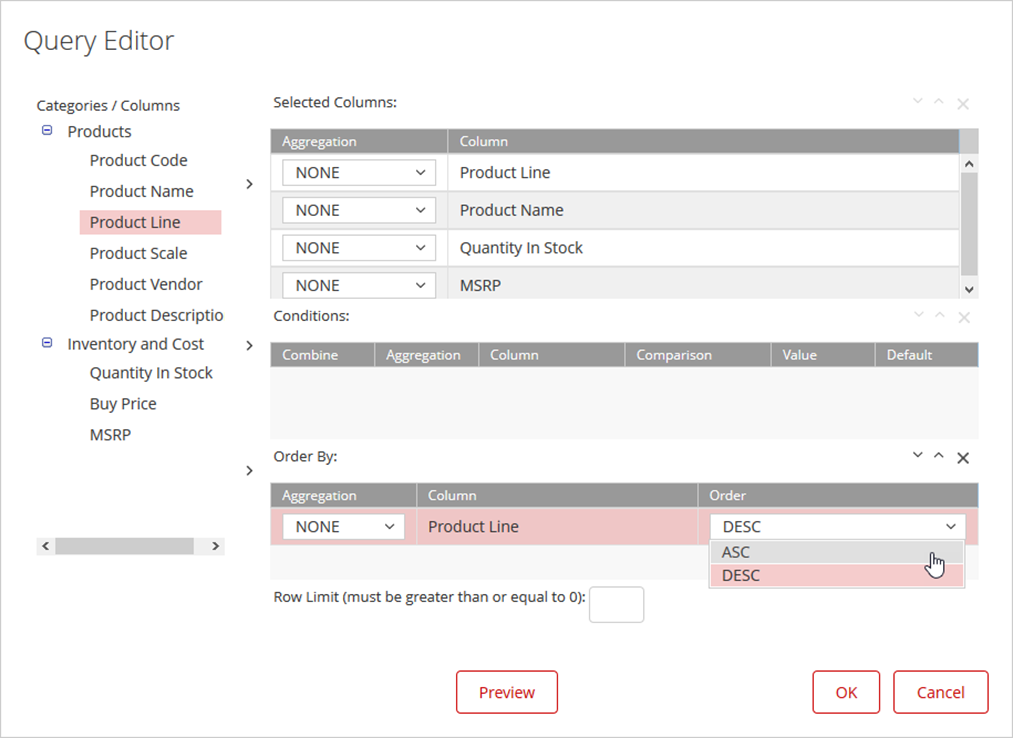
1. Add Product Line to the Selected Columns:
• From the Categories/Columns list, expand Products.
• Click Product Line.
• Click the top arrow to move Product Line to the Selected Columns area.
2. Repeat the previous step to add Products -> Product Name, Inventory and Cost > Quantity In Stock, and Inventory and Cost -> MSRP to the Selected Columns area.
3. To ASC Sort by Product Line and create the table:
• From the Categories/Columns list, click Product Line.
• Click the bottom arrow to move Product Line to the Order By area.
• Click OK.
4. In the Title text box, type Inventory Table, and then click Apply.
Inventory Table
***
#### Chart
1. In the Untitled 2 header, click Insert Content, and then click Chart.
2. From the Select Data Source dialog, click Inventory, and then click OK.
Condition: Product Line begins with M
3. Add columns to the Selected Columns:
• From the Categories/Columns list expand Products.
• Click Product Line.
• Click the top arrow to move Product Line to the Selected Columns area.
• Expand Inventory and Cost.
• Click Quantity in Stock.
• Click the top arrow to move Quantity in Stock to the Selected Columns area.
• Click MSRP.
• Click the top arrow to move MSRP to the Selected Columns area.
4. Add a condition for Product Line and open the Chart Designer:
• From the Categories/Columns list, click Product Line.
• Click the middle arrow to move Product Line to the Conditions area.
• From the Comparison drop-down list, select begins with.
• In the Value column, type M.
• Click OK.
5. To create the chart, complete the following fields in the Chart Designer window, and then click OK:
Chart
| Field | Entry |
| --------------- | ----------------- |
| Series Column | Product Line |
| Category Column | Quantity in Stock |
| Values Column | MSRP |
| Chart Title | Inventory |
| X Axis Title | Qty |
| Y Axis Title | MSRP |
| {% endtab %} | |
| {% endtabs %} | |
---
# Agent Instructions
This documentation is published with GitBook. GitBook is the documentation platform designed so that both humans and AI agents can read, navigate, and reason over technical content effectively. Learn more at gitbook.com.
## Querying This Documentation
If you need additional information that is not directly available in this page, you can query the documentation by asking a question.
Perform an HTTP GET request on the following URL with the `ask` and `goal` query parameters:
```
GET https://academy.pentaho.com/pentaho-business-analytics/business-analytics/dashboard-designer/inventory.md?ask=&goal=
```
`ask` is the immediate question: it should be specific, self-contained, and written in natural language.
`goal` is what the user is ultimately trying to achieve, the reason they need the answer. Sharing it helps GitBook give you a better, more relevant answer. A goal is most helpful when it describes the outcome the user wants rather than restating the question. For example, with `ask=how do I create an API token`, a goal like `automate deployments from our CI pipeline` lets GitBook tailor the answer to that use case.
The response will contain a direct answer to the question and relevant excerpts and sources from the documentation.
Use this mechanism when the answer is not explicitly present in the current page, you need clarification or additional context, or you want to retrieve related documentation sections.