
Data Identification
Dictionaries & Data Patterns ..
Data Identification
Pentaho Data Catalog uses data identification methods called Dictionaries and Data Patterns to help you identify data.

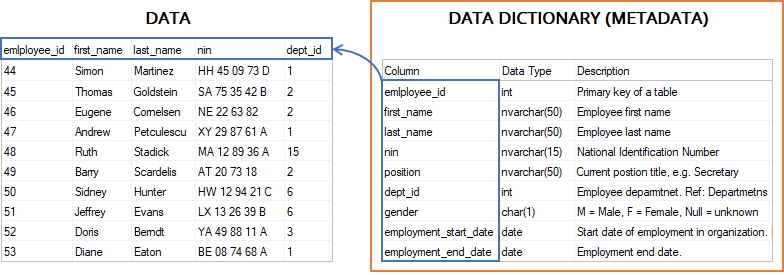
Data Dictionaries in Data Catalogs
A data dictionary in a data catalog is a specialized collection of predefined terms, values, and definitions used to automatically classify and tag data elements within an organization's datasets. Unlike traditional data dictionaries that simply define terminology, catalog data dictionaries function as intelligent matching tools that scan actual data content to identify and categorize information.
These dictionaries serve as automated reference systems that help data catalogs recognize specific types of data by comparing column values against predefined lists of known terms. For example, a country codes dictionary might contain "US," "CA," "GB" to automatically identify geography-related columns, while a product name dictionary could contain specific product identifiers to classify commercial data.
Log into Data Catalog:
Username: [email protected]
Password: Welcome123!
Types of Data Dictionaries
Modern data catalogs typically support two categories of dictionaries:
System-Defined Dictionaries: Built-in collections that come pre-configured with the catalog, containing common data types like ISO country codes, currency symbols, or standard industry classifications.
User-Defined Dictionaries: Custom collections created by organizations to match their specific business context and terminology. These can be created through multiple approaches:
Importing structured files (CSV with JSON definitions)
Building dictionaries through the user interface
Extracting dictionary terms directly from existing profiled data columns
Pentaho Data Catalog ships with 95 In-built Dictionaries, pre-configured with common data types: e.g. ISO country codes, currency symbols, or standard industry classifications.
Let's take a look at: Marital_Status
Click: Data Operations > Data Identification Methods.

Click on Dictionaries.

Click on the Name to sort A - Z.

Scroll to Page ⅘
Click on the 3 dots for Marital_Status > View


Click on Rules
Follow steps 1-6 outlined in : View - System Dictionary
Select: Edit

Dictionary UI
For the time being a quick overview of the Fields and Description as we'll be covering the UI in more detail when creating our own User-defined Dictionaries:

Category
Select a category or type a category name and click Add New to add it as a new category.
You can also remove an existing category.
Apply Values
Upload Dictionary
Click Upload Dictionary to upload a one-column CSV file containing dictionary file definitions and enter a number 0.00 to 1.0 for the confidence score.
Select Column
Click Select Column to set a profiled column of data to use for the dictionary.
Click Add Column to browse the navigation tree for a column to add for dictionary values.
Select the column you want to use. Note: The column you select must already be profiled.
Click Update.
Enter a number 0.00 to 1.0 for the confidence score.
Column Name Regex (1)
Regex
Add a regex as a metadata hint for the column name. Enter a number 0.00 to 1.0 for the confidence score.
Condition
AND / OR
In the Condition pane, you can click the Delete icon and remove the existing condition or click Add Condition and select an Attribute, Operator, and Value to set an additional condition.
Select either AND or OR to apply multiple conditions to evaluate and match the data.
Actions
Assign Tags
Click Assign Tags and enter a tag to assign to the data.
Assign Table Tags
Click Assign Table Tags and enter a table tag to assign to the data.
Assign Business Term
Click Assign Business Term to select a business term to assign to the data.
Browse the navigation tree for one or more business terms and select the associated checkboxes.
A number on the Add button shows the number of terms you have selected.
Click Add.
Data Patterns
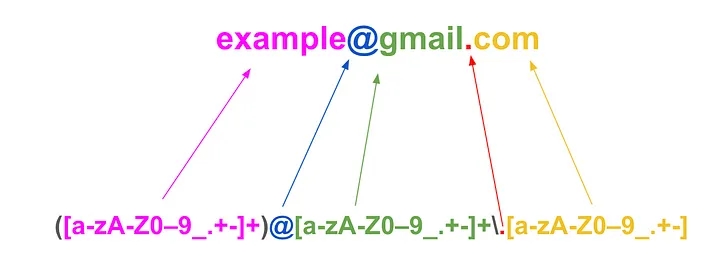
A pattern analysis (or data patterns) defines the data pattern, regular expression, column alias(es) and tags that you can use to identify a column of data. You can use data patterns for a variety of purposes, such as regular expression (RegEx) generation, data identification, and data quality checking.
Data Patterns in Data Identification
Data patterns play a crucial role in identifying and categorizing data within a data catalog. These patterns are essentially recurring characteristics or behaviors in data sets that can be recognized and used to automate data management.
'Getting Started' -> 'Identify the data' explained how data patterns are used to profile the data
Pattern Analysis
Data Pattern Analysis reduces each data item into a simple pattern essentially using dimensional reduction for each character position in the input text. The result is a string which indicates where alphabetic characters, numeric characters, symbols, and whitespace appear.
Widget Parts #
KT1734-B
KT189A-D
KT2231-C
The pattern consists of the following characters:
a
lower case alphabet character
A
upper case alphabetic character
n
digit 0 -> 9
w
whitespace character (space, tab)
s
symbol character (e.g., -/|!£$%^&*()+=[]{}@#~;:,.?¬¥§¢" )
-
Some other character (control, special symbol, etc.)
Others
Any other symbol may be treated as “significant” (such as a dash, underscore, or colon). These are output as-is in the generated data pattern for the entry.
Additional tests could be built into the algorithm to look for certain additional characteristics. For example, date formats can be very tricky. PDC could observe that ‘nn/nn/nnnn’ is a date and could then observe whether it is predominantly ‘mm/dd/yyyy’ or if its ‘dd/mm/yyyy.’
Another enhancement is detecting credit card numbers.
Pattern Character Poistion
Lets dive a bit deeper into: Part Codes
Part numbers often begin with two or three designated letters. This observation helps in defining a more precise RegEx rule based on observed patterns.
Additionally, tracking the "largest" and "smallest" values for each character position in these patterns reveals the degree of variability per position. Each time a pattern recurs, a counter tallies its occurrence; upon identifying a new pattern, the system stores the analyzed data as a distinct “sample” for that pattern.
The first step is to generate a substitution string (for purpose of the example, not all possible characters are shown):
The top row is the character lookup row; and the bottom row is the substitution to be made for each character position.
For example, “KT127-3” would generate a simple pattern “AAnnn-n”. Additionally, the largest and smallest character seen for each character position is also tracked.
Consider a set of Part Codes and the associated pattern for each:
KT17341
AAnnnnn
KL91632
AAnnnnn
KW81234
AAnnnnn
KW91020
AAnnnnn
KA002021
AAnnnnnn
AAnnnnn – Occurs 4 times
KA11220 – Lowest character seen in each position
KW97644 – Highest character seen in each position
AAnnnnnn – Occurs 1 time
KA002021 – Lowest character seen in each position
KA002021 – Highest character seen in each position
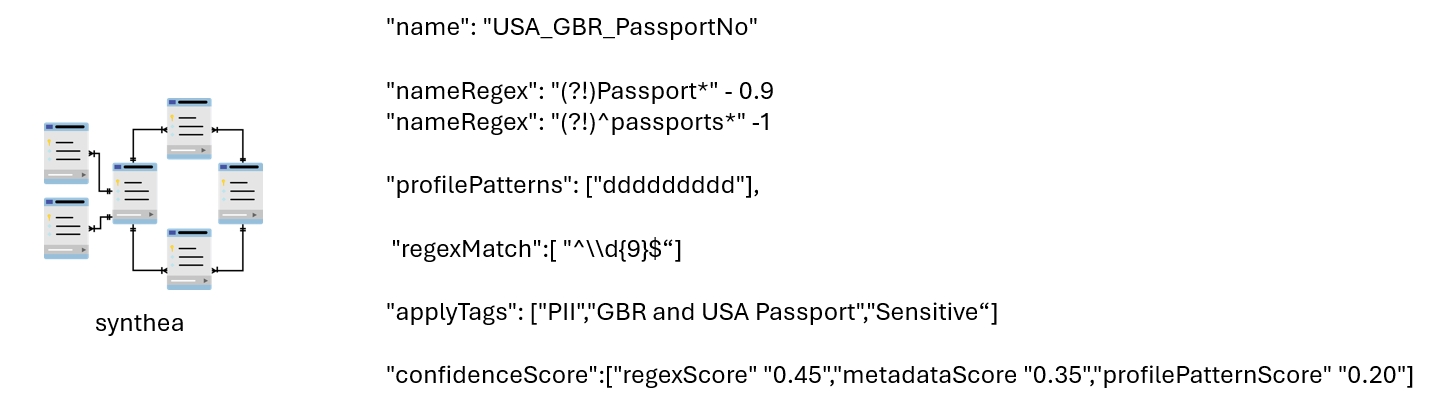
Let's run through an example: USA_GBR_Passport_Numbers.
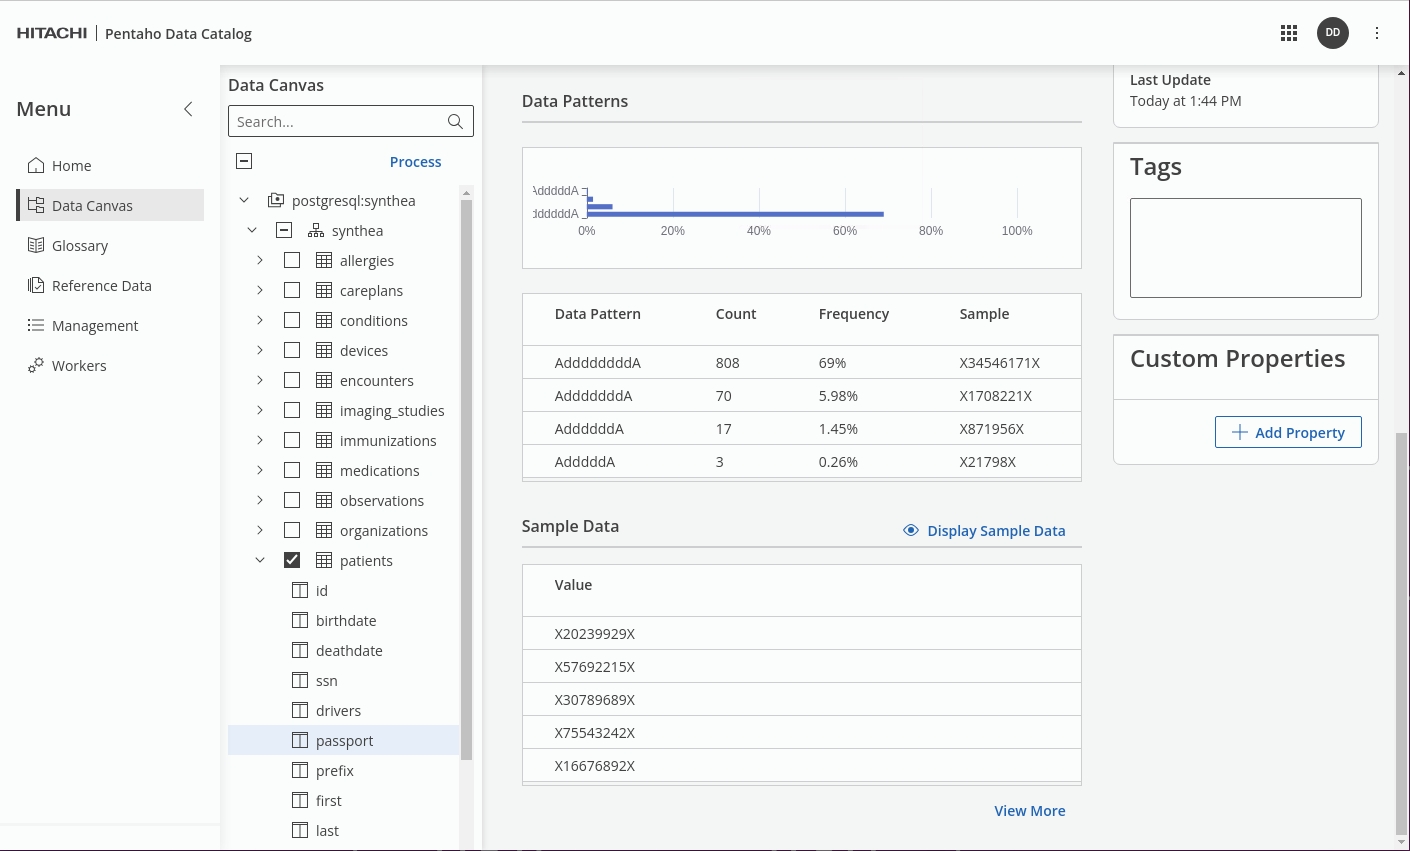
Navigate to the 'Management' tile & click on: patterns.
InSearch for: USA_GBR_Passport_Numbers.
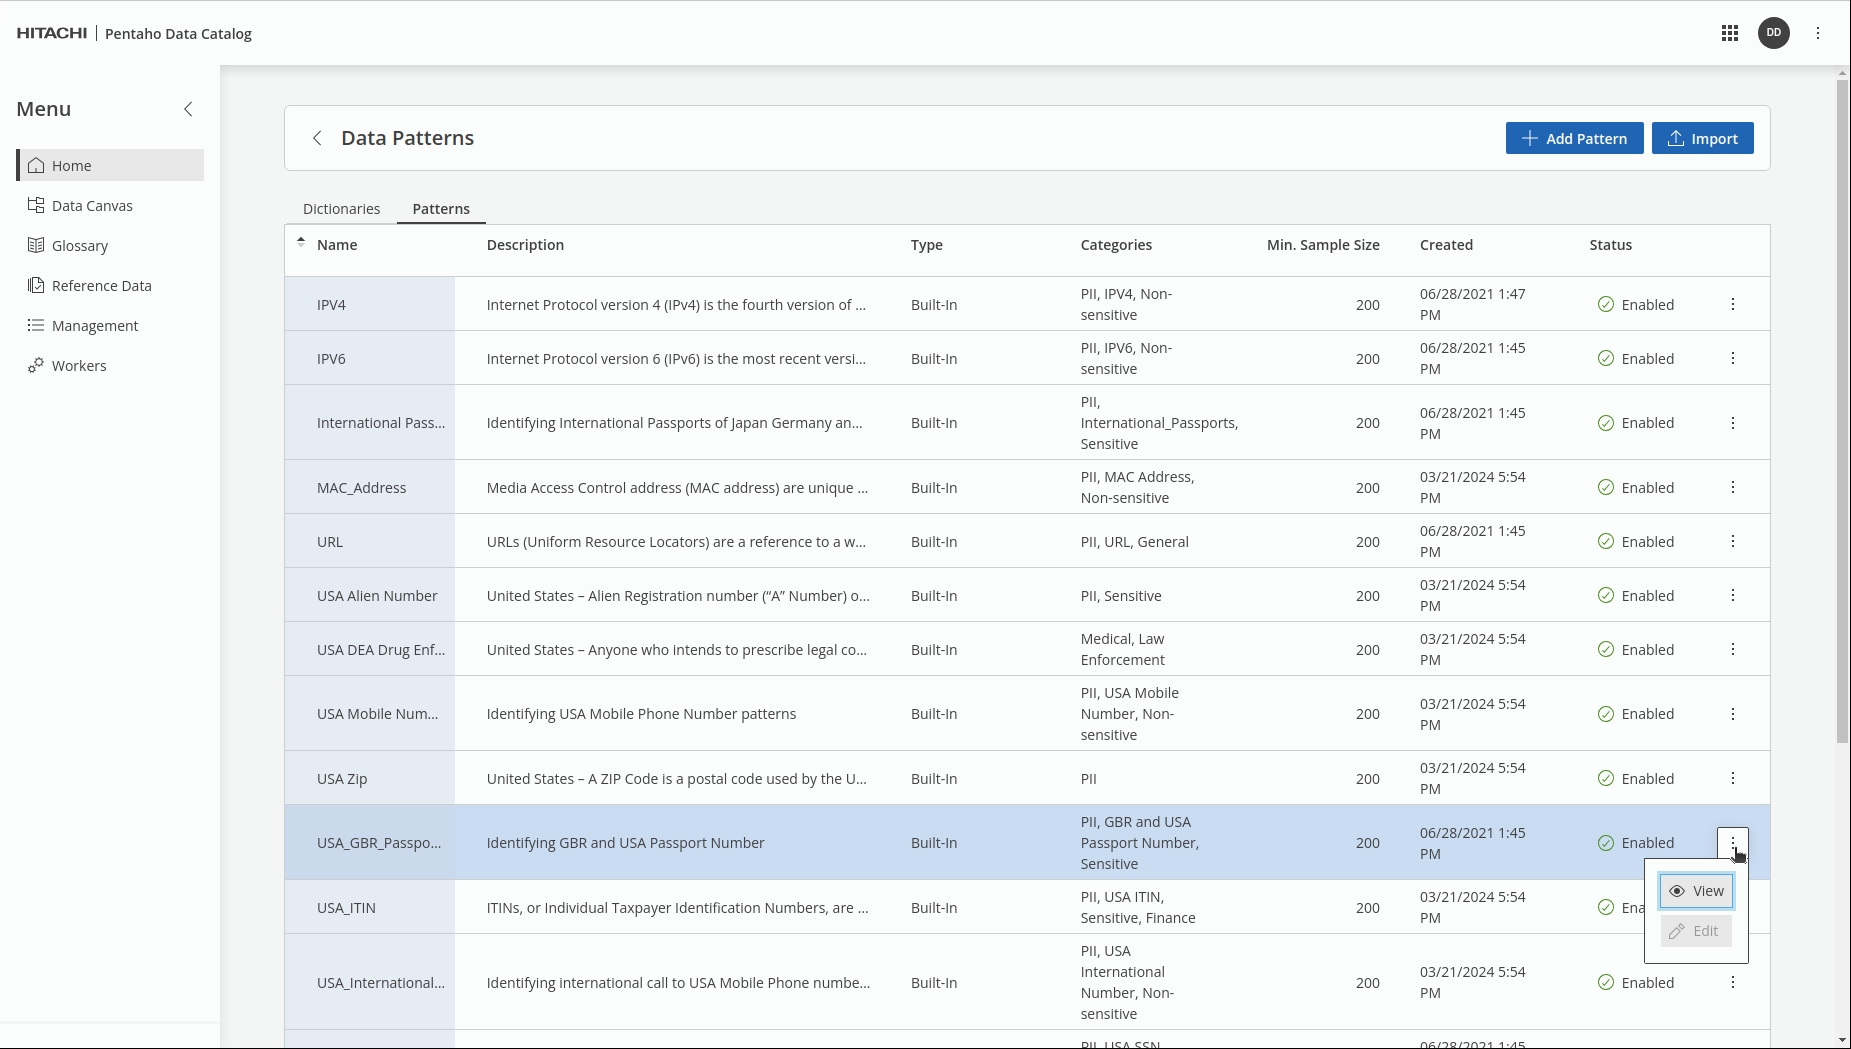
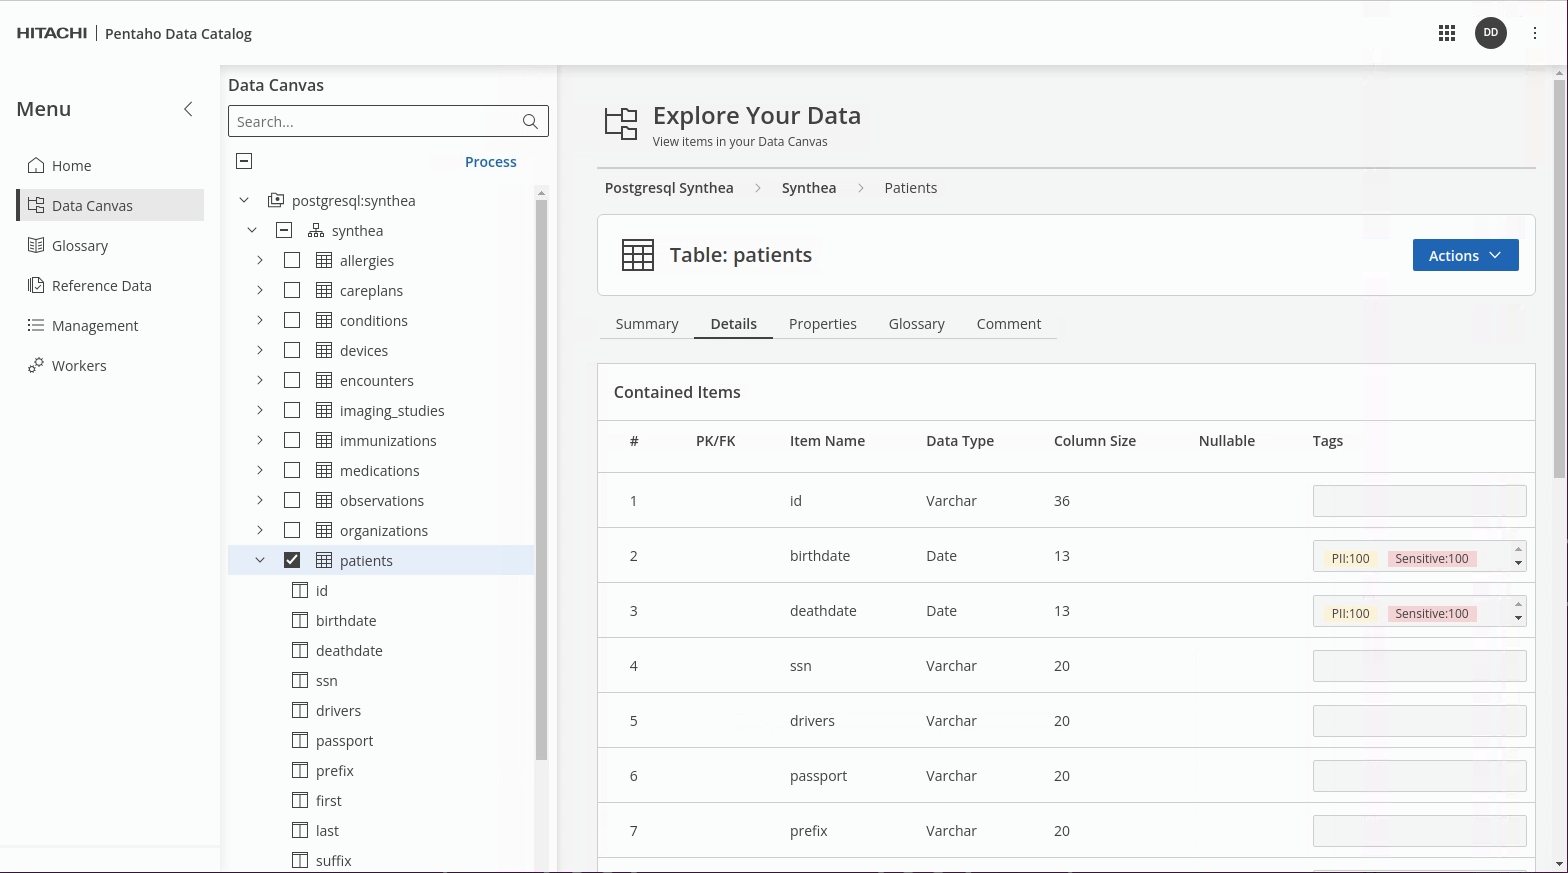
When the data is profiled, in our example: 'passport' the regexMatch will produce a profilePattern that can be compared (with a degree of confidence) against the predefined profilePattern; once matched Tags - PII, GBR and USA Passport, Sensitive are then applied.
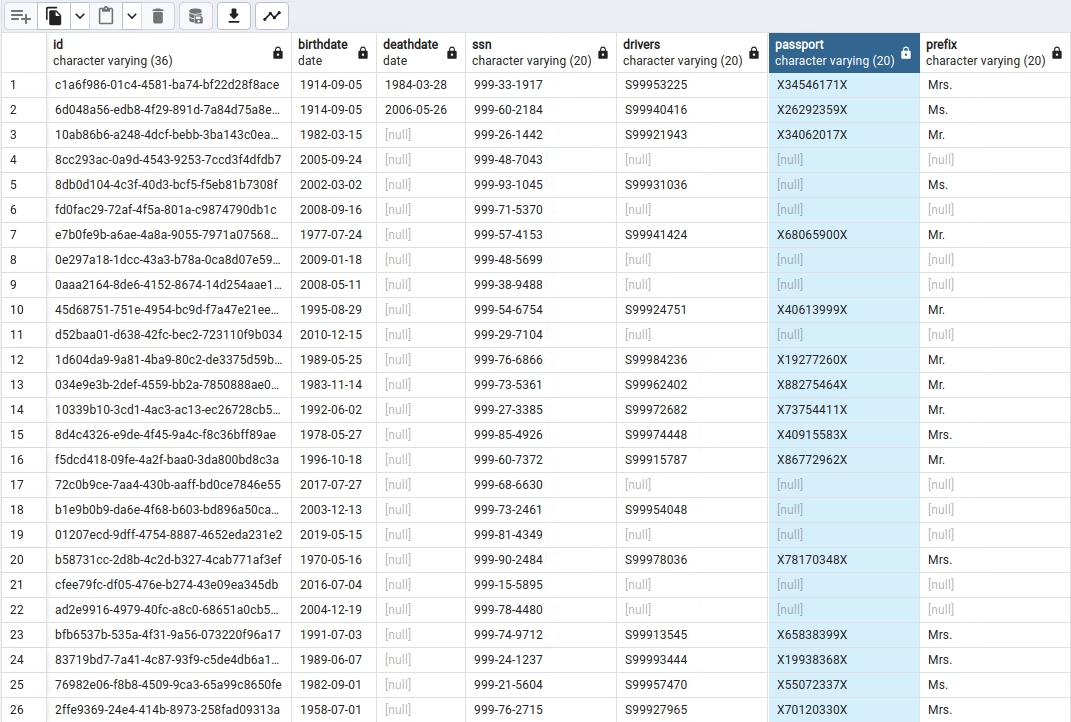
View the data in the Patients table.
For further information: take a look at Data Patterns in Data Identification Methods.
Next -> 2.2 Rules
Policies
The dictionaries and data patterns are together referred to as data identification policies. There are many policies included with Data Catalog, covering categories from a wide range of business sectors, such as Finance, Education, Aviation, Law Enforcement, PCI-DSS and Data Privacy.
After running data identification, you can use the Galaxy View feature to visualize the data tagging, identify the data flow, locate your data, and view the sensitivity and security.
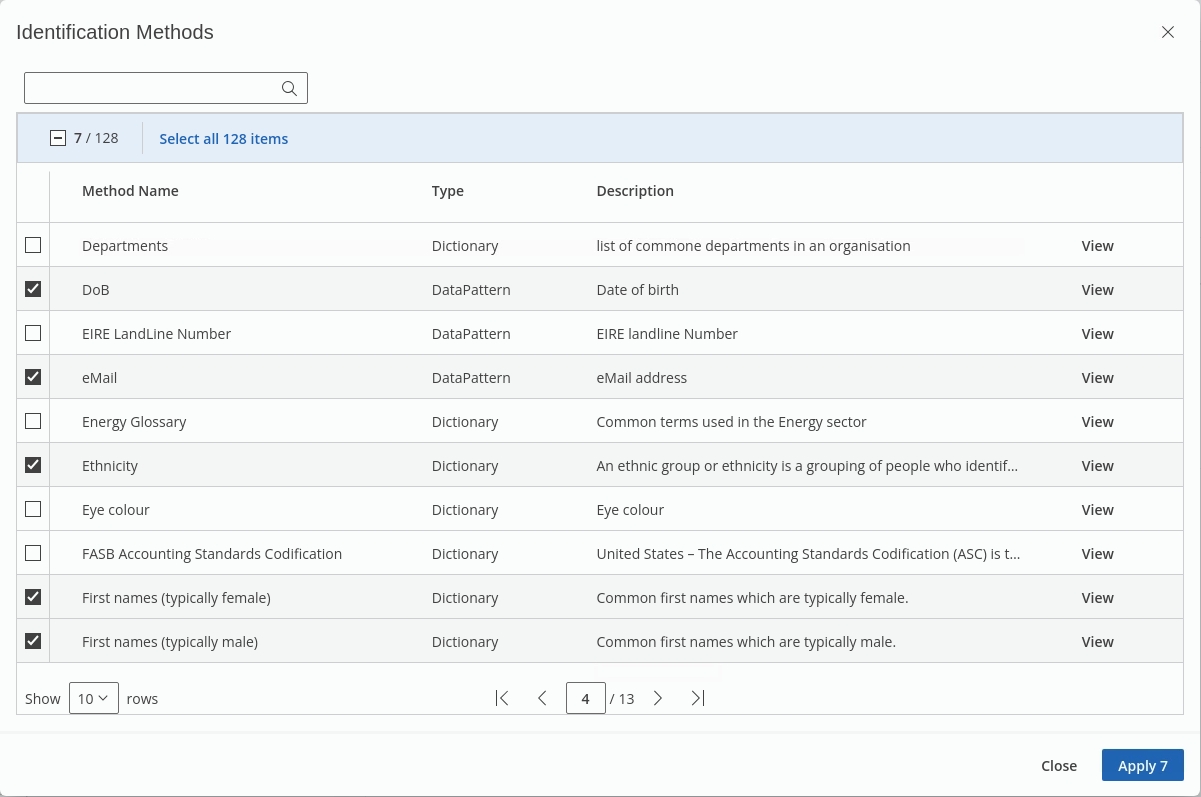
Select the following 'Method Names' to define your policy:
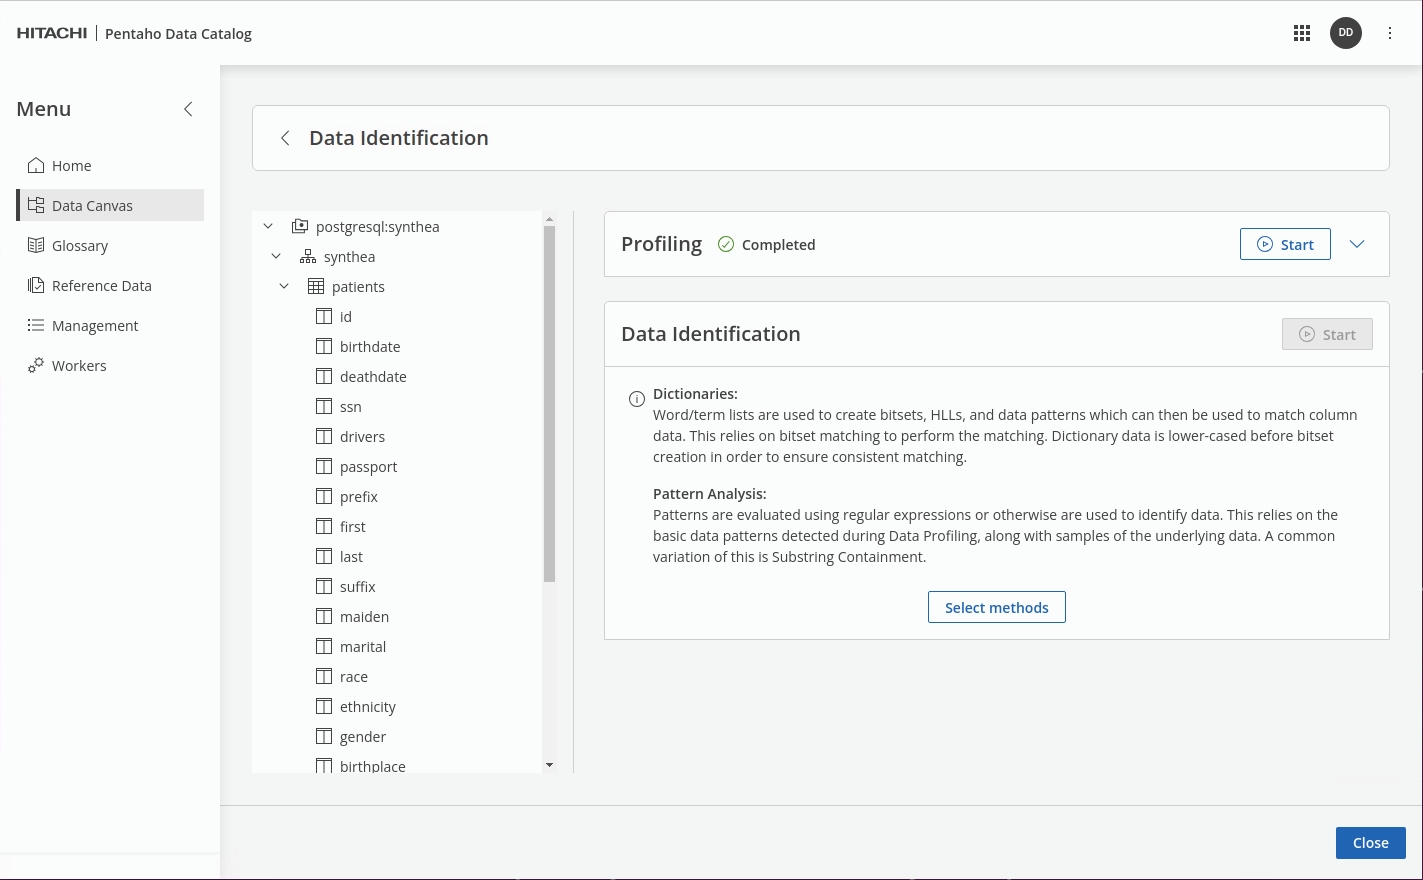
Once the Data Identification step has completed, check the results in the Data Canvas.

Click the Data Identification tile.
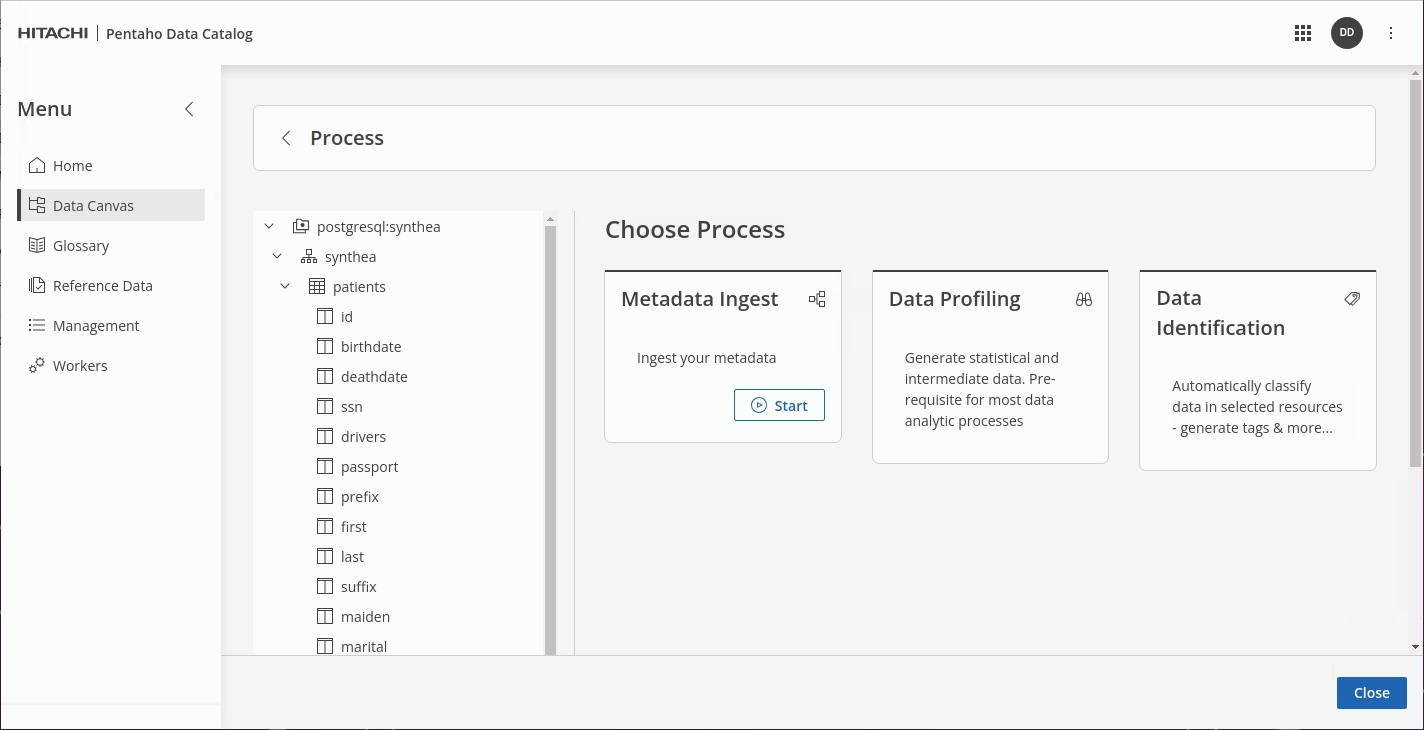
Click 'Select Methods'.
Select the following Data Dictionaries & Data Patterns:
USA_SSN
Social Security Number
Country Codes
Country Names
Country Names
Country Names
DoB
Date of Birth
USA States
States in USA
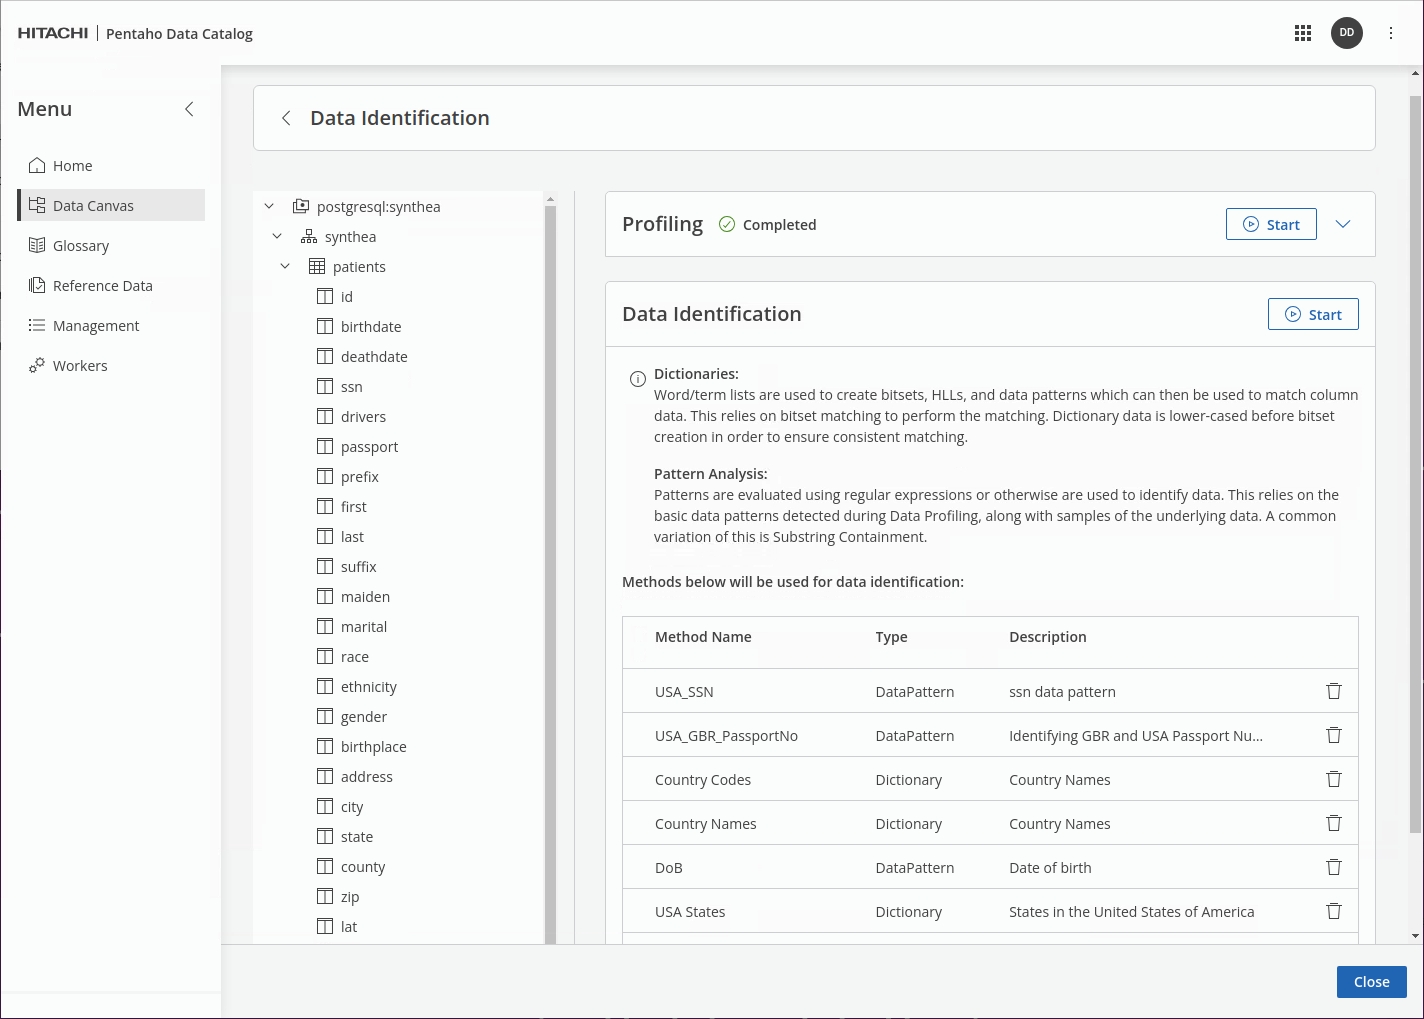
Click Start.
Track the Job in the Workers.
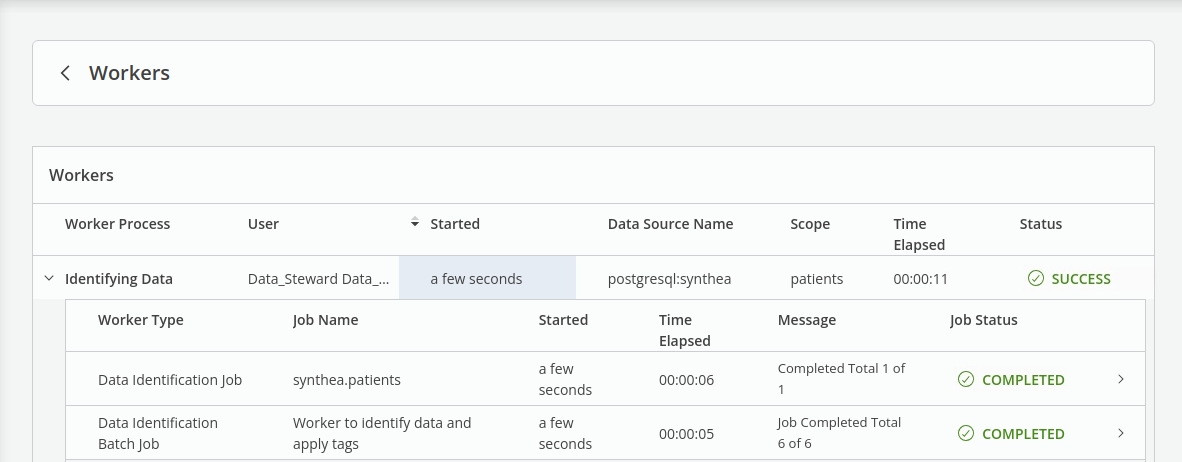
In Data Canvas, check that the sensitive data in the Synthea -> 'patients' table has now been identified - tagged as PII & Sensitive.
x
x
Last updated
Was this helpful?