> For the complete documentation index, see [llms.txt](https://academy.pentaho.com/llms.txt). Markdown versions of documentation pages are available by appending `.md` to page URLs; this page is available as [Markdown](https://academy.pentaho.com/pentaho-business-analytics/business-analytics/interactive-reports/ships-and-trains.md).
# Ships & Trains
Another Interactive Report ..
{% hint style="warning" %}
#### Workshop - Ships & Trains Ordered
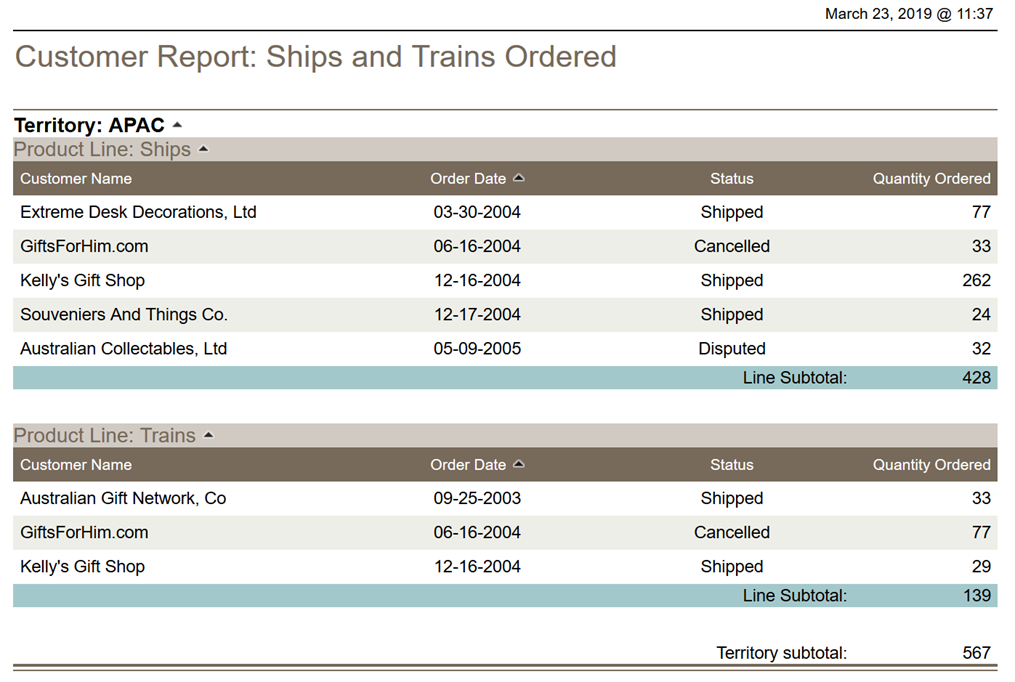
Building on your Interactive Reporting foundation, this workshop challenges you to create a business report independently using the skills you've developed. The sales manager at Steel Wheels needs visibility into a specific product category - ships and trains - and has requested a report that shows ordering patterns for these product lines across customers and territories. This workshop gives you the opportunity to apply your knowledge without step-by-step guidance, mirroring real-world report development scenarios.
In this hands-on workshop, you'll work more independently to construct a filtered, grouped, and summarized report that meets specific business requirements. You'll make decisions about data selection, grouping strategy, and formatting while following guidelines that define the expected outcome. You'll practice filtering data to specific product lines, creating meaningful hierarchical groupings that reveal patterns across territories and product categories, implementing sorting to organize chronological data, and calculating subtotals at multiple levels to support analysis.
**What You'll Accomplish:**
* Select the Orders data source and apply the Left Aligned - Nickel report template
* Add required data columns (Customer Name, Order Date, Status, Quantity Ordered)
* Filter the report to display only Ships and Trains product lines
* Create hierarchical groups with Territory as the primary group and Product Line as a subgroup
* Sort the report by Order Date in ascending order
* Add subtotals for Quantity Ordered at both the Product Line and Territory levels
* Calculate and display a grand total for all orders
* Customize page headers and footers with appropriate text
* Adjust column widths and refine formatting for professional presentation
* Save the completed report to the repository with a descriptive name
By the end of this workshop, you'll have demonstrated your ability to create a complete business report independently based on requirements rather than detailed instructions. You'll have practiced the decision-making skills that professional report developers use daily: determining appropriate grouping hierarchies, selecting which measures to summarize, and formatting output for business users.
**Prerequisites:** Completion of previous Interactive Reports workshops (Sales Territory, Orders NA & EMEA)\
**Estimated Time:** 20 minutes
{% endhint %}
Report - Ships & Trains
{% hint style="info" %}
#### Report Guidelines
The following guidelines may help you in creating your report:
• Use the Orders data source and the Left Aligned - Nickel template
• Add text to the page header and footer
• Change the column sizes and refine the report format appropriately
• The report should be sorted by Order Date and should show subtotals for each Product Line by Territory, as well as a grand total.
{% endhint %}
---
# Agent Instructions
This documentation is published with GitBook. GitBook is the documentation platform designed so that both humans and AI agents can read, navigate, and reason over technical content effectively. Learn more at gitbook.com.
## Querying This Documentation
If you need additional information that is not directly available in this page, you can query the documentation dynamically by asking a question.
Perform an HTTP GET request on the current page URL with the `ask` query parameter, and the optional `goal` query parameter:
```
GET https://academy.pentaho.com/pentaho-business-analytics/business-analytics/interactive-reports/ships-and-trains.md?ask=&goal=
```
`ask` is the immediate question: it should be specific, self-contained, and written in natural language.
`goal` is optional and describes the broader end goal you are ultimately trying to accomplish on behalf of the user. GitBook uses it to tailor the answer towards what is most useful for that goal.
The response will contain a direct answer to the question and relevant excerpts and sources from the documentation.
Use this mechanism when the answer is not explicitly present in the current page, you need clarification or additional context, or you want to retrieve related documentation sections.