# MDX Query
{% hint style="info" %}
#### Understanding MDX Queries
Multidimensional Expressions (MDX) is a query language designed to retrieve data from multidimensional databases, often called cubes. Think of a cube like a sophisticated Excel pivot table on steroids—it organizes business data across multiple dimensions like Time, Geography, Products, and Measures.
When you query a cube with MDX, you get back a cell set, which is essentially a grid of data values organized by the dimensions you specify.
{% endhint %}
MDX Syntax
{% hint style="info" %}
Just like SQL uses SELECT to query relational databases, MDX uses SELECT to query cubes. The basic structure is surprisingly similar, but adapted for multidimensional data. This is the most frequently used query in MDX, and understanding it gives you a solid foundation for working with multidimensional data.
Every MDX SELECT query needs to specify four key things:
**Axes (Grid Layout)**
* Define how your results are organized—typically COLUMNS and ROWS
* You can use up to 128 axes (though most queries use just 2-3)
* Think of this as defining your report structure
**Members or Tuples (what data to show)**
* Specify which items from each dimension appear on each axis
* Example: Which years? Which products? Which metrics?
**Cube Name (Data Source)**
* Which cube contains your data
* Like specifying a table in SQL's FROM clause
**Slicer Axis (Constraint)**
* Optional WHERE clause that filters your entire result set
* Think of it as "showing data for only this specific context"
{% endhint %}
***
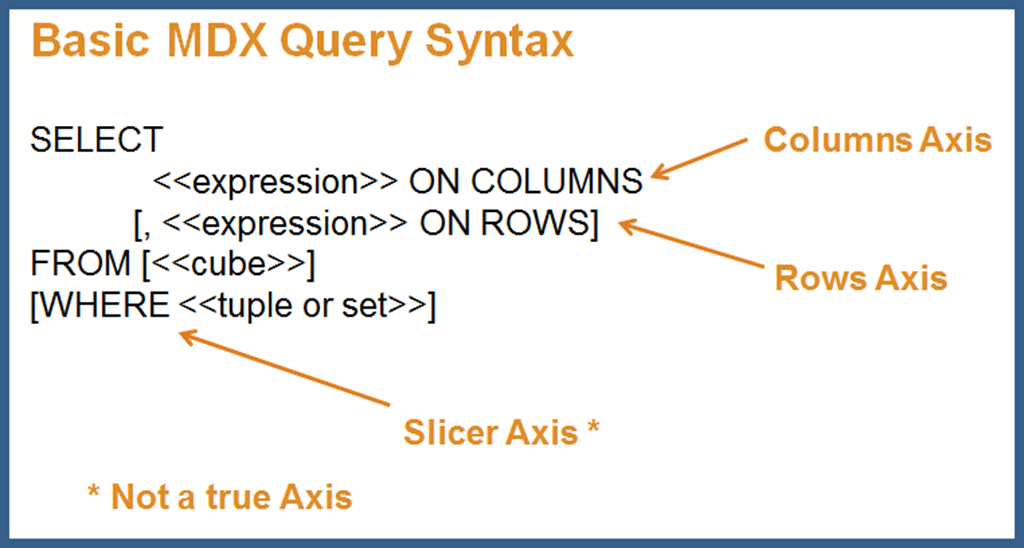
**MDX Syntax Structure**
```
SELECT
ON COLUMNS,
ON ROWS
FROM
WHERE
```
**Examples:**
{% tabs %}
{% tab title="Key Concepts" %}
{% hint style="info" %}
* **Curly Braces `{}`**: Group multiple members together
* `{ [Measures].[Sales], [Measures].[Quantity] }` = "show both these measures"
* **Square Brackets `[]`**: Identify dimension/member names
* `[Years].[2004]` = "the 2004 member of the Years dimension"
* **ON COLUMNS / ON ROWS**: Define your grid layout
* Columns = horizontal axis (across the top)
* Rows = vertical axis (down the side)
* **WHERE Clause**: Filters the entire result
* Unlike columns/rows, WHERE doesn't create an axis—it just filters
{% endhint %}
{% endtab %}
{% tab title="Basic Sales Report" %}
```mdx
SELECT
{ [Measures].[Sales], [Measures].[Quantity] } ON COLUMNS,
{ [Years].&[2004], [Years].&[2005] } ON ROWS
FROM [SteelWheelsSales]
WHERE ( [Markets].[APAC] )
```
{% hint style="info" %}
**What this query does:**
* **COLUMNS**: Shows two metrics side-by-side: Sales and Quantity
* **ROWS**: Shows two years stacked: 2004 and 2005
* **FROM**: Gets data from the SteelWheelsSales cube
* **WHERE**: Filters to show only APAC (Asia-Pacific) market data
{% endhint %}
**Result set would look like:**
| | Sales | Quantity |
| ------------ | ---------- | -------- |
| 2004 | $1,500,000 | 12,500 |
| 2005 | $1,750,000 | 14,200 |
| {% endtab %} | | |
{% tab title="Simplified Query" %}
```mdx
SELECT
Measures.ALLMEMBERS ON COLUMNS
FROM [SteelWheelsSales]
WHERE ([Years].[2004])
```
{% hint style="info" %}
**What this does:**
* **COLUMNS**: Shows ALL available measures (Sales, Quantity, Profit, etc.)
* **FROM**: SteelWheelsSales cube
* **WHERE**: Filters to show only 2004 data
* **ROWS**: None specified—results in a single-row display
{% endhint %}
**Result might look like:**
| Sales | Quantity | Profit | Cost |
| ------------ | -------- | ------ | ------ |
| $3M | 25,000 | $450k | $2.55M |
| {% endtab %} | | | |
{% tab title="Product Performance by Quarter" %}
```mdx
SELECT
{ [Time].[Q1], [Time].[Q2], [Time].[Q3], [Time].[Q4] } ON COLUMNS,
{ [Product].[Classic Cars], [Product].[Motorcycles], [Product].[Planes] } ON ROWS
FROM [SteelWheelsSales]
WHERE ( [Measures].[Sales], [Years].[2005] )
```
{% hint style="info" %}
**What this shows:**
* **COLUMNS**: Four quarters across the top
* **ROWS**: Three product lines down the side
* **WHERE**: Filtering to Sales measure only, for year 2005
{% endhint %}
**Result grid:**
| | Q1 | Q2 | Q3 | Q4 |
| ------------- | ----- | ----- | ----- | ----- |
| Classic Cars | $500K | $525K | $475K | $600K |
| Motorcycles | $200K | $225K | $210K | $240K |
| Planes | $150K | $160K | $155K | $175K |
| {% endtab %} | | | | |
| {% endtabs %} | | | | |
***
**Think of MDX Like This ..**
Imagine you're building a pivot table:
* **SELECT ... ON COLUMNS** = dragging fields to the column area
* **SELECT ... ON ROWS** = dragging fields to the row area
* **FROM** = choosing your data source
* **WHERE** = using report filters at the top
The result is always a grid (cell set) with your data organized exactly as you specified!
***