> For the complete documentation index, see [llms.txt](https://academy.pentaho.com/llms.txt). Markdown versions of documentation pages are available by appending `.md` to page URLs; this page is available as [Markdown](https://academy.pentaho.com/pentaho-ctools/use-cases/retail-sales/sales-analysis-dashboard.md).
# Sales Analysis Dashboard
{% hint style="info" %}
So we have the building blocks in place .. time to start bringing it all together with a Workshop that builds on the concepts learnt in 'My First Dashboard'.
* In Layout tab:
* Create the row and column structure
* Name your HTML objects
* In Data Sources tab:
* Create your SQL queries
* Test them to ensure they work
* In Components tab:
* Add all components
* Configure their properties
* Link to HTML objects
* Set up listeners
* Preview and test:
* Use the preview button
* Test all filters
* Verify chart interactions
{% endhint %}
x
{% tabs %}
{% tab title="Mock-up" %}
{% hint style="info" %}
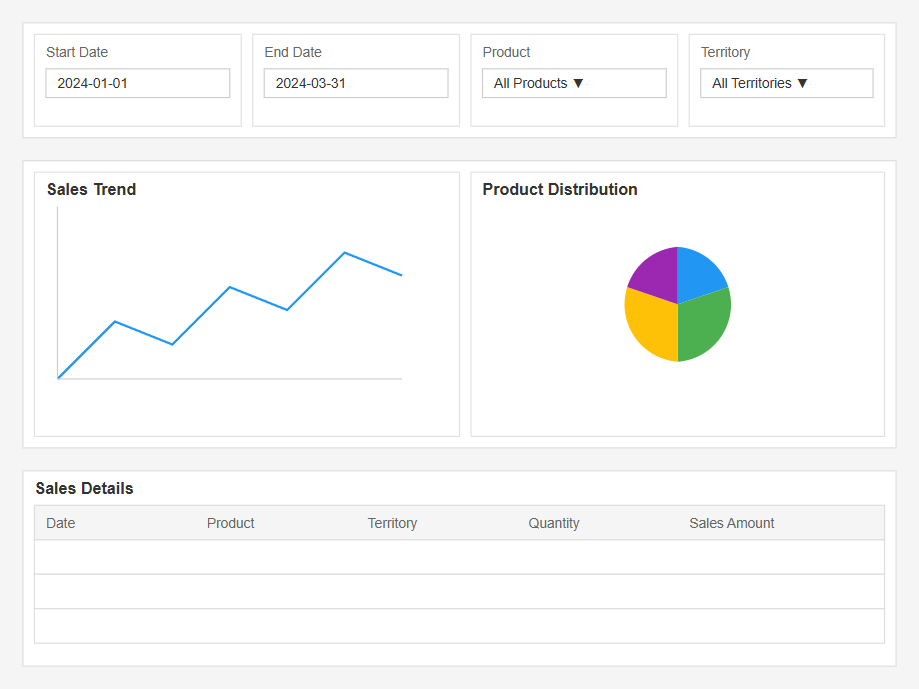
We're going to assume that the discovery phase has been completed and after iteration the initial dashboard design has been completed and signed off.
Key Features:
* Interactive date range selection
* Multi-select product line and country filters
* Trend analysis chart
* Product distribution pie chart
* Detailed data table with pagination
* Auto-updating components when filters change
{% endhint %}
Sales Analysis Dashboard - mock-up
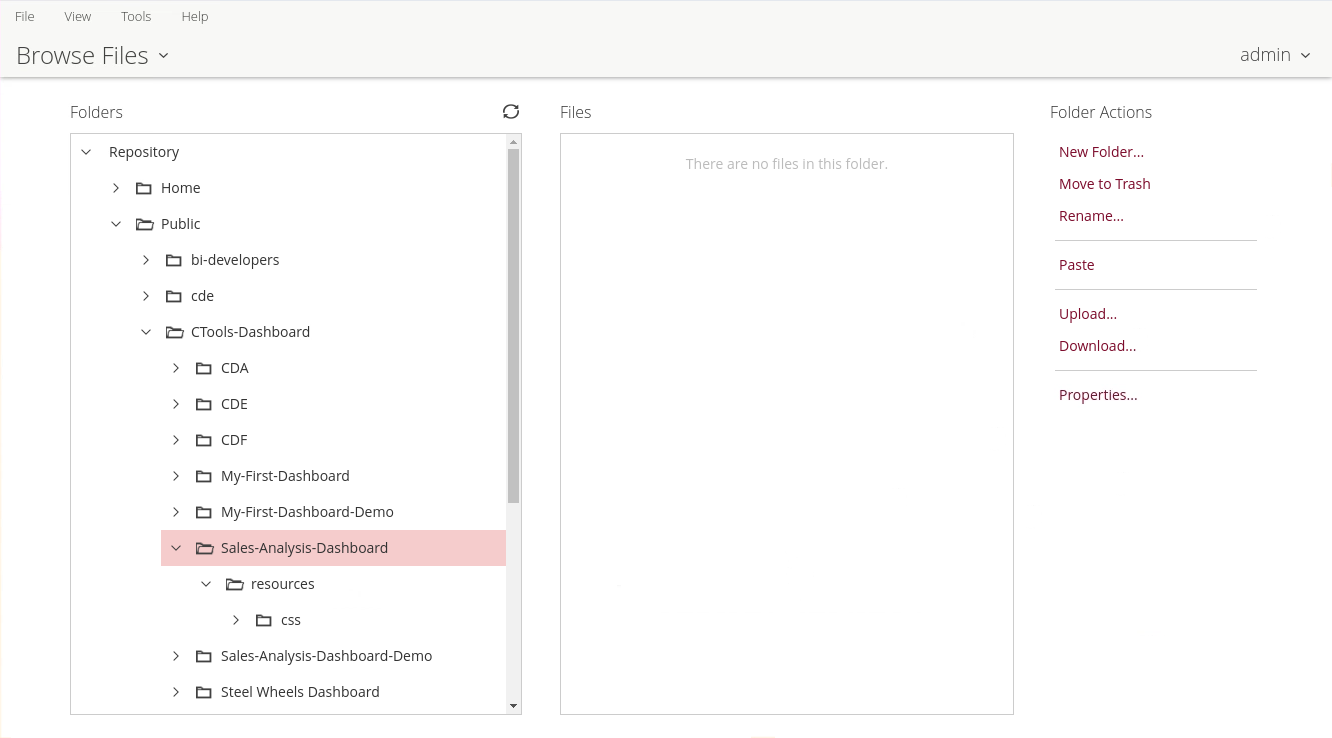
1. Log into the Pentaho Server.
2. Select: Browse Files.
3. Create the following folders
Sales Analysis Dashboard - Folders
1. In the Pentaho User Console (PUC) and select from the menu: File -> New -> CDE Dashboard.
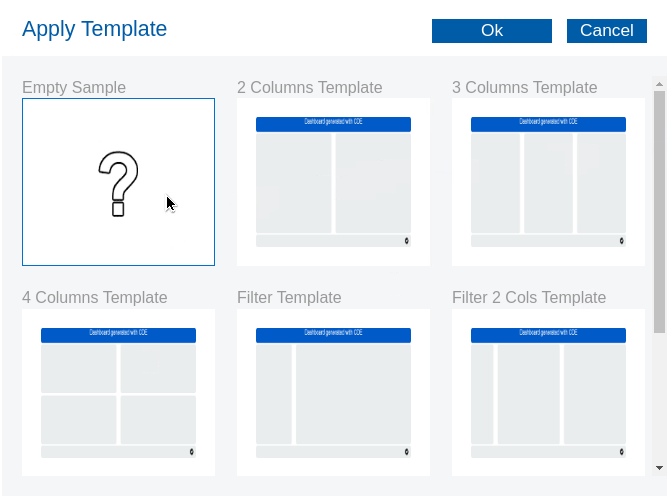
2. Click on the Template option.
3. Select: Empty Sample.
Empty sample
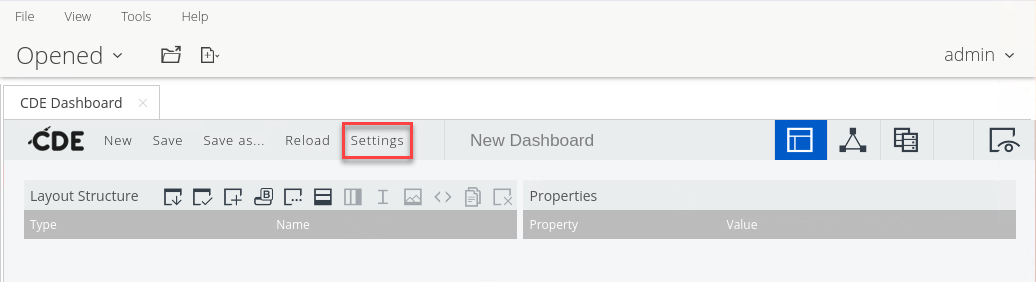
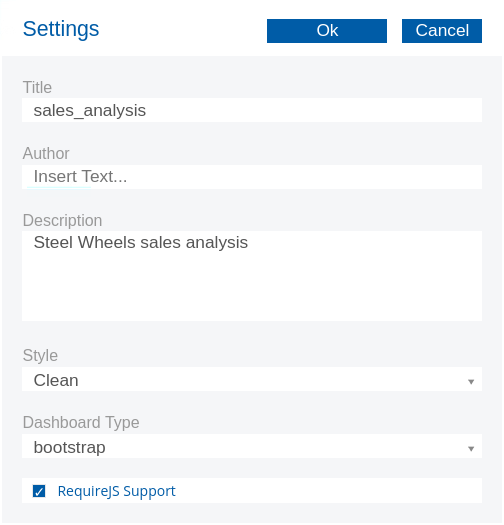
4. Click on: Settings and enter the following details:
5. Enter the following details:
5. Click Ok.
x
x
{% endtab %}
{% tab title="Layout " %}
{% hint style="info" %}
The mock-up now needs to be 'mapped' to CDE Layout.
We'll be using the 'Bootstrap' template.
{% endhint %}
```
Root Container
│
├── Filter Row (id: filterRow)
│ ├── Date Filters Column (span: 4)
│ ├── Product Filters Column (span: 4)
│ └── Additional Filters Column (span: 4)
│
├── Charts Row (id: chartsRow)
│ ├── Trend Chart Column (span: 8)
│ └── Pie Chart Column (span: 4)
│
└── Table Row (id: tableRow)
└── Data Table Column (span: 12)
```
x
{% endtab %}
{% tab title="First Tab" %}
{% hint style="info" %}
Following the CDA structure for a datasource type = sql.jdbc
{% endhint %}
1. Define the CDA connection to: sampledata database.
```xml
pentaho_adminpassword
```
2. Upload the sampledata.cda file to: /Public/CTools-Dashboards/5min-Dashboard directory on the Pentaho Server.
```xml
org.mariadb.jdbc.Driverjdbc:mariadb://localhost:3306/sampledatayour_usernameyour_passwordSales Data All Years
SELECT
YEAR(o.ORDERDATE) as YEAR,
MONTH(o.ORDERDATE) as MONTH,
o.ORDERNUMBER,
o.ORDERDATE,
o.STATUS,
o.CUSTOMERNUMBER,
c.CUSTOMERNAME,
c.COUNTRY,
p.PRODUCTCODE,
p.PRODUCTNAME,
p.PRODUCTLINE,
od.QUANTITYORDERED,
od.PRICEEACH,
(od.QUANTITYORDERED * od.PRICEEACH) as TOTAL_AMOUNT
FROM
ORDERS o
JOIN ORDERDETAILS od ON o.ORDERNUMBER = od.ORDERNUMBER
JOIN PRODUCTS p ON od.PRODUCTCODE = p.PRODUCTCODE
JOIN CUSTOMERS c ON o.CUSTOMERNUMBER = c.CUSTOMERNUMBER
ORDER BY
o.ORDERDATE, o.ORDERNUMBER
```
{% hint style="info" %}
Further details on the SQL Query.
{% endhint %}
```sql
SELECT
-- Time-based columns for analysis
YEAR(o.ORDERDATE) as YEAR, -- Extracts just the year from date (e.g., 2004)
MONTH(o.ORDERDATE) as MONTH, -- Extracts month number (1-12)
-- Order information
o.ORDERNUMBER, -- Unique order identifier
o.ORDERDATE, -- Full date of the order
o.STATUS, -- Order status (e.g., Shipped, Delivered)
-- Customer information
o.CUSTOMERNUMBER, -- Unique customer identifier
c.CUSTOMERNAME, -- Name of the customer
c.COUNTRY, -- Customer's country
-- Product information
p.PRODUCTCODE, -- Unique product identifier
p.PRODUCTNAME, -- Name of the product
p.PRODUCTLINE, -- Product category (e.g., Classic Cars)
-- Order details and calculations
od.QUANTITYORDERED, -- Number of items ordered
od.PRICEEACH, -- Price per unit
(od.QUANTITYORDERED * od.PRICEEACH) as TOTAL_AMOUNT -- Calculated total for line item
```
**FROM and JOIN Clauses**:
```sql
FROM
ORDERS o -- Main orders table with alias 'o'
JOIN ORDERDETAILS od -- Table containing line items for each order
ON o.ORDERNUMBER = od.ORDERNUMBER -- Links orders to their details
JOIN PRODUCTS p -- Product information table
ON od.PRODUCTCODE = p.PRODUCTCODE -- Links order details to specific products
JOIN CUSTOMERS c -- Customer information table
ON o.CUSTOMERNUMBER = c.CUSTOMERNUMBER -- Links orders to customer info
```
**Table Relationships**:
{% hint style="info" %}
* `ORDERS` (o): Main table containing order headers
* Primary Key: ORDERNUMBER
* Contains: ORDERDATE, STATUS, CUSTOMERNUMBER
* `ORDERDETAILS` (od): Contains individual line items
* Composite Key: ORDERNUMBER, PRODUCTCODE
* Contains: QUANTITYORDERED, PRICEEACH
* `PRODUCTS` (p): Product catalog
* Primary Key: PRODUCTCODE
* Contains: PRODUCTNAME, PRODUCTLINE
* `CUSTOMERS` (c): Customer information
* Primary Key: CUSTOMERNUMBER
* Contains: CUSTOMERNAME, COUNTRY
{% endhint %}
**Ordering**:
{% hint style="info" %}
* Sorts results first by date
* Then by order number for orders on the same date
{% endhint %}
```sql
ORDER BY
o.ORDERDATE, o.ORDERNUMBER
```
***
{% hint style="info" %}
And finally .. test the sampledata.cda connection.
{% endhint %}
{% endtab %}
{% endtabs %}
x
x
---
# Agent Instructions
This documentation is published with GitBook. GitBook is the documentation platform designed so that both humans and AI agents can read, navigate, and reason over technical content effectively. Learn more at gitbook.com.
## Querying This Documentation
If you need additional information that is not directly available in this page, you can query the documentation dynamically by asking a question.
Perform an HTTP GET request on the current page URL with the `ask` query parameter, and the optional `goal` query parameter:
```
GET https://academy.pentaho.com/pentaho-ctools/use-cases/retail-sales/sales-analysis-dashboard.md?ask=&goal=
```
`ask` is the immediate question: it should be specific, self-contained, and written in natural language.
`goal` is optional and describes the broader end goal you are ultimately trying to accomplish on behalf of the user. GitBook uses it to tailor the answer towards what is most useful for that goal.
The response will contain a direct answer to the question and relevant excerpts and sources from the documentation.
Use this mechanism when the answer is not explicitly present in the current page, you need clarification or additional context, or you want to retrieve related documentation sections.