> For the complete documentation index, see [llms.txt](https://academy.pentaho.com/llms.txt). Markdown versions of documentation pages are available by appending `.md` to page URLs; this page is available as [Markdown](https://academy.pentaho.com/pentaho-business-analytics/business-analytics/analyzer-reports/emea-quantity.md).
# EMEA Quantity
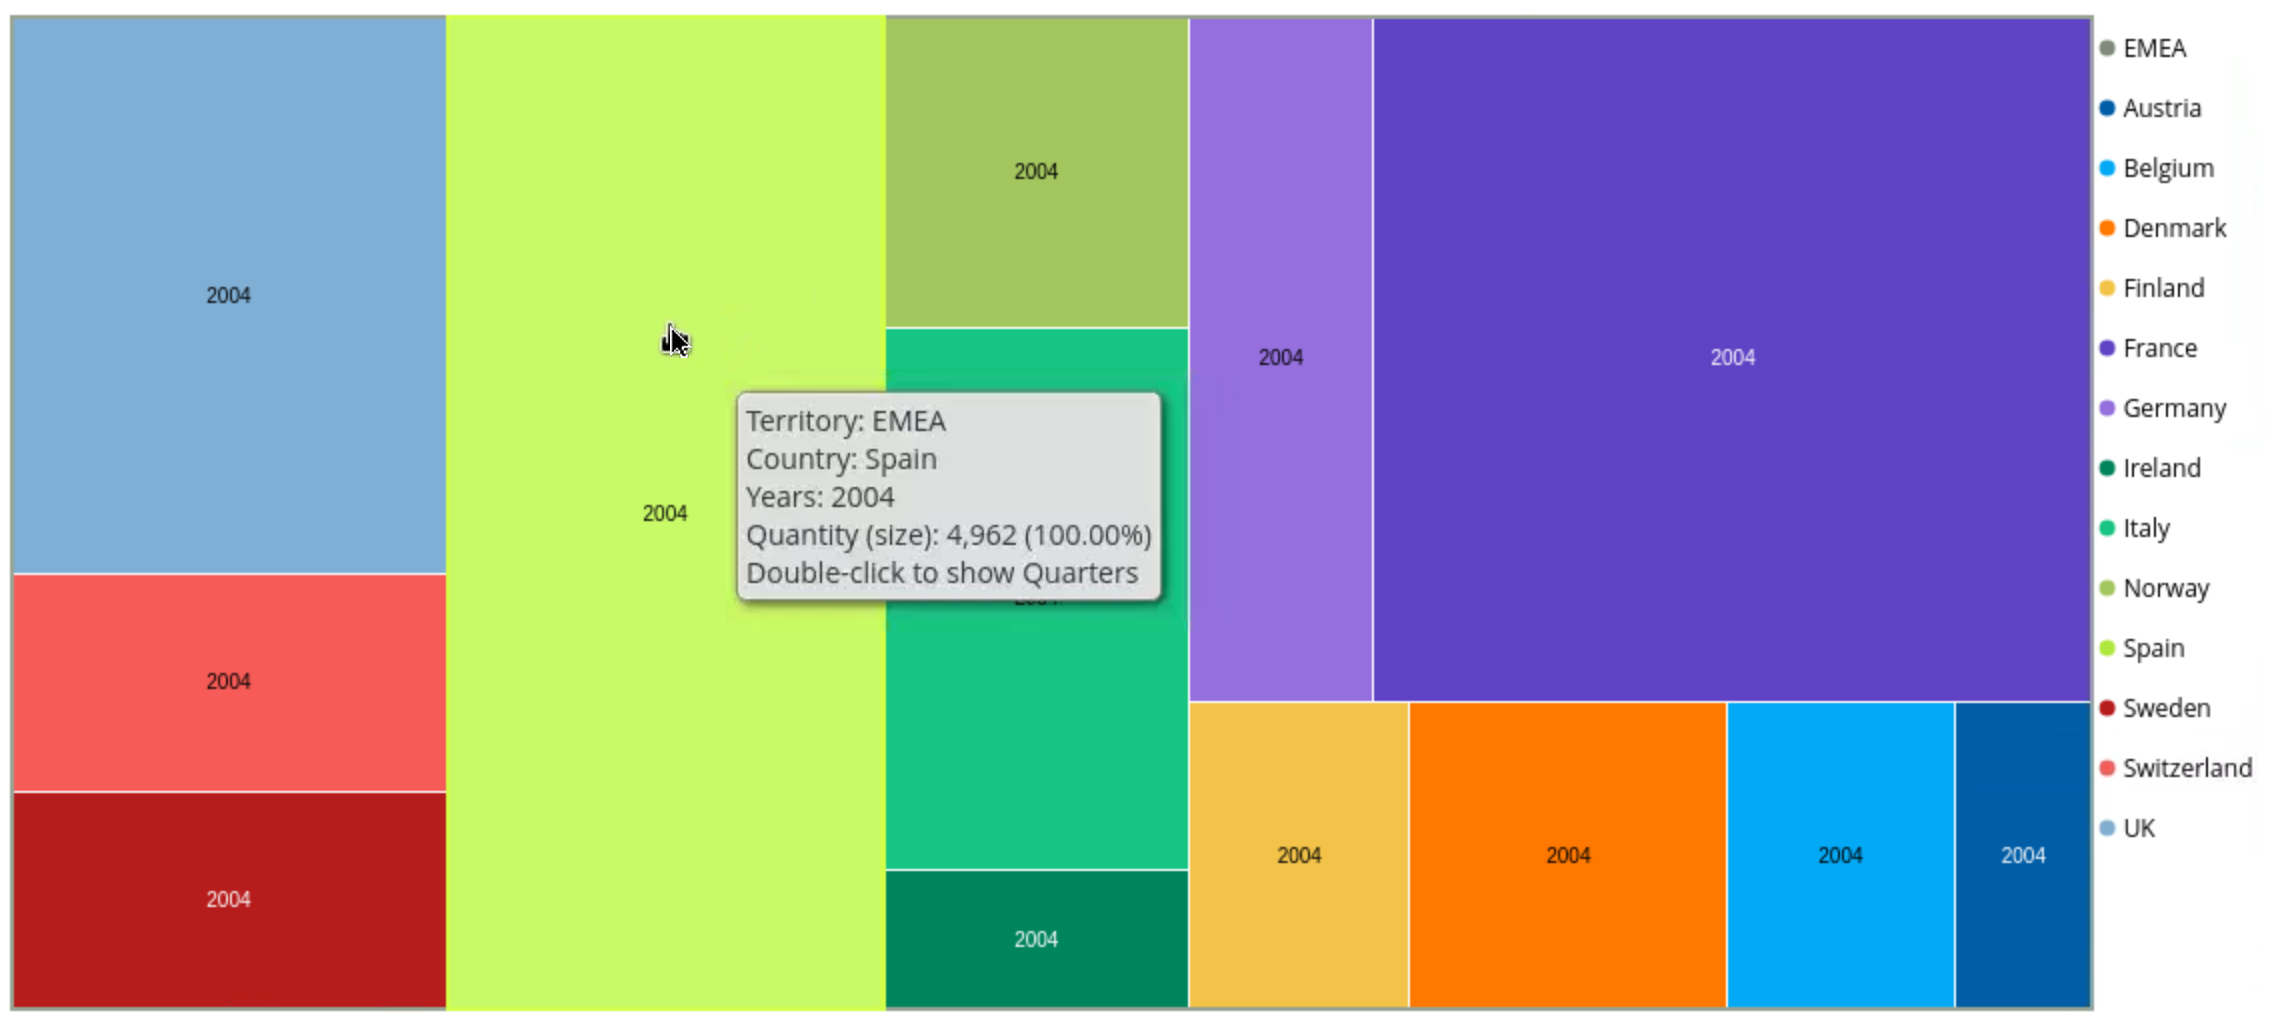
Quantity sold in EMEA for 2004 ..
{% hint style="warning" %}
#### Workshop - Quantity Sold
After mastering the fundamentals of Analyzer in the Sales Analysis workshop, it's time to apply those skills independently to solve a real business problem. Steel Wheels management needs visibility into product quantity performance across the EMEA region for the year 2004, and has requested an analysis that reveals which countries are driving volume in this key territory. This workshop challenges you to build a complete Analyzer report with less step-by-step guidance, mirroring the autonomous analytical work you'll perform in production environments.
In this hands-on workshop, you'll construct an analysis from scratch using the skills you've developed, making independent decisions about structure and formatting while following specific business requirements. You'll create a hierarchical analysis that breaks down quantity sold by territory and country, apply filtering to isolate the EMEA region and 2004 time period, and enhance the analysis with conditional formatting that makes patterns immediately visible. You'll implement ranking calculations to identify top-performing countries, explore different chart types to find the most effective visualization, and publish the finished analysis to the repository for organizational use. This exercise bridges the gap between guided learning and the independent analytical work expected of business intelligence professionals.
**What You'll Accomplish:**
* Select the SteelWheels:SteelWheelsSales data source to begin your analysis
* Build the analysis structure by adding Quantity as a measure, Territory and Country as rows, and Years as columns
* Apply filters to restrict the analysis to EMEA territory and the year 2004
* Implement data bar conditional formatting (green) on the Quantity measure for visual impact
* Add grand totals for columns to show overall quantity performance
* Create a user-defined ranking measure to identify top-performing countries by quantity sold
* Switch from table to chart format and experiment with multiple visualization types (tree map, bar chart, etc.)
* Refine the analysis with appropriate formatting and presentation elements
* Save the completed analysis to the Public/Training folder with a descriptive name (EMEA: Quantity Sold by Territory Yr2004)
By the end of this workshop, you'll have demonstrated your ability to create a professional Analyzer report independently based on business requirements rather than detailed instructions. You'll have practiced the analytical decision-making that business intelligence professionals use daily, from choosing appropriate measures and dimensions to selecting visualizations that best communicate insights. This independent practice solidifies your Analyzer skills and prepares you to respond confidently to analytical requests from business stakeholders.
**Prerequisites:** Completion of Sales Analysis workshop, Pentaho Business Analytics Server with Steel Wheels sample data\
**Estimated Time:** 25-30 minutes
{% endhint %}
EMEA: Quantity Sold by TerritoryYr004 -Tree Map
***
{% stepper %}
{% step %}
**Data Source**
1. From the User Console Home Perspective, click Create New > Analysis Report.
{% hint style="info" %}
If you have any other reports open, this same functionality can be accessed under the File menu on the menu bar.
{% endhint %}
2. In the Select Data Source window, click SteelWheels:SteelWheelsSales, and then click OK.
3. Switch to 'Schema View'.
{% endstep %}
{% step %}
**Add Data Columns and Rows to the Analysis**
To add Quantity, Territory, Country, and Years to the analysis:
1. Select Quantity and drag it to the Measures drop zone on the Layout panel.
2. Select Territory and drag it to the Rows drop zone on the Layout panel.
3. Select Country and drag it to the Rows drop zone on the Layout panel. Drop Country *below* Territory.
4. Select Years and drag it to the Columns drop zone on the Layout panel.
{% endstep %}
{% step %}
**Filter the Analysis Data**
To filter the analysis to only include EMEA and 2004:
1. To turn on the Filters panel, on the Toolbar, click the Filters button.
2. To filter on Territory, from the Available Fields, select Territory and drag it to the Filters panel.
3. To display only EMEA, in the Filter on Territory dialog box:
• Select Select from a list.
• From the list of values, click EMEA.
• Click the right arrow to move EMEA to the Currently Included list.
• Click OK.
4. To filter on Years, from the Available Fields, select Years and drag it to the Filters panel.
5\. To display only 2004, in the Filter on Years dialog box:
• Select Select from a list.
• From the list of values, click 2004.
• Click the right arrow to move 2004 to the Currently Included list.
• Click OK.
{% endstep %}
{% step %}
**Apply Conditional Formatting**
To display a data bar background:
1. To apply data bar conditional formatting, in the analysis details, right-click the Quantity header, and then select Conditional Formatting > Data Bar: Green.
{% endstep %}
{% step %}
**Add Totals**
To display totals for columns and rows:
1. To show grand totals for columns, from the Layout panel:
• Click Report Options.
• In the Report Options window, select Show Grand Totals for Columns.
• Click OK.
{% endstep %}
{% step %}
#### Rank
To create a column showing the rank for each country based on Quantity:
1. Right-click the Quantity header, then select User Defined Measure > % of, Rank, Running Sum.
2. In the New % of, Rank, Running Sum, etc. window:
• Select Rank by Quantity.
• Click Next.
• Click Done.
{% endstep %}
{% step %}
**Switch to Chart Format**
To switch to chart format:
1. On the analysis title bar, click the View As Chart button.
2. Select a suitable Chart type - try out various types ..
{% endstep %}
{% step %}
#### Refine the Report
Refine the report by adding:
{% endstep %}
{% step %}
**Save the Report**
1. On the toolbar click the 'Save as' icon.
2. Add the following report details:
• In the Filename field, type: EMEA: Quantity Sold by Territory Yr2004.
• For the location, click the Up One Level icon twice.
• In the list of folders, double-click Public.
• In the list of folders, double-click Training.
• Click Save.
{% endstep %}
{% endstepper %}
***
---
# Agent Instructions
This documentation is published with GitBook. GitBook is the documentation platform designed so that both humans and AI agents can read, navigate, and reason over technical content effectively. Learn more at gitbook.com.
## Querying This Documentation
If you need additional information that is not directly available in this page, you can query the documentation dynamically by asking a question.
Perform an HTTP GET request on the current page URL with the `ask` query parameter, and the optional `goal` query parameter:
```
GET https://academy.pentaho.com/pentaho-business-analytics/business-analytics/analyzer-reports/emea-quantity.md?ask=&goal=
```
`ask` is the immediate question: it should be specific, self-contained, and written in natural language.
`goal` is optional and describes the broader end goal you are ultimately trying to accomplish on behalf of the user. GitBook uses it to tailor the answer towards what is most useful for that goal.
The response will contain a direct answer to the question and relevant excerpts and sources from the documentation.
Use this mechanism when the answer is not explicitly present in the current page, you need clarification or additional context, or you want to retrieve related documentation sections.